Fig A.1
Download original image
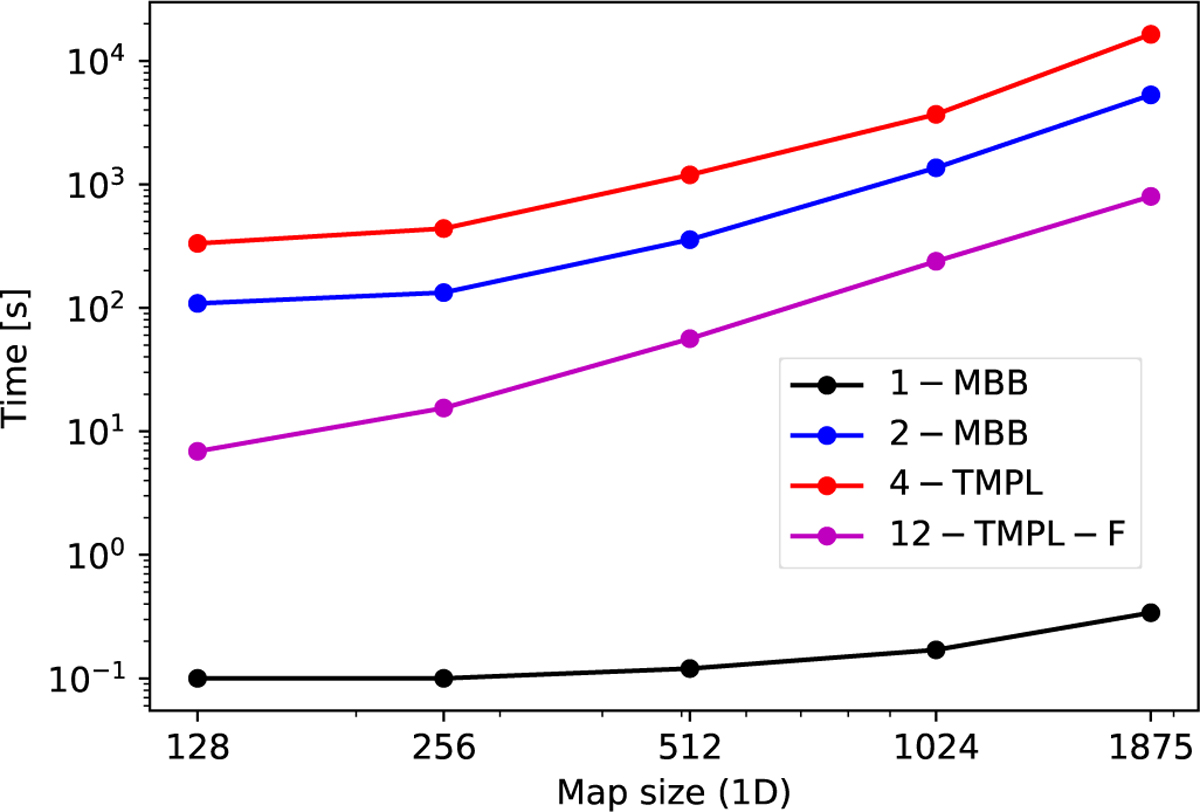
Comparison of run times of different SED fits. The observations are from the IRDC model, and the map size is varied from 128 × 128 to 1875 × 1875 pixels. Apart from 1-MBB, beam convolution is always part of model that is being fitted. The number of fitted SED components is given in the legend, and TMPL – F stands for optimisation in the Fourier space.
Current usage metrics show cumulative count of Article Views (full-text article views including HTML views, PDF and ePub downloads, according to the available data) and Abstracts Views on Vision4Press platform.
Data correspond to usage on the plateform after 2015. The current usage metrics is available 48-96 hours after online publication and is updated daily on week days.
Initial download of the metrics may take a while.