Fig. 17
Download original image
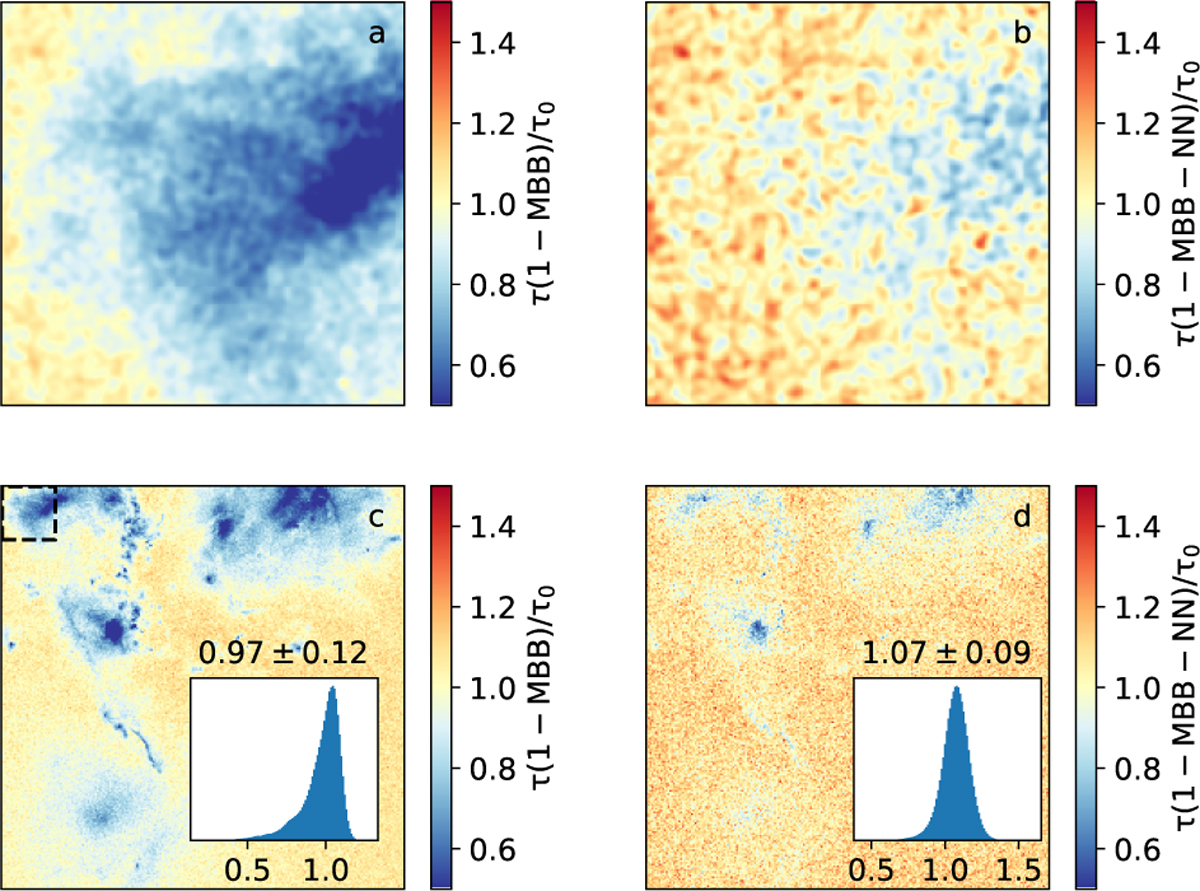
Correction to 1-MBB τ estimates calculated with neural nets. Frame a shows the 246 × 246 pixel map that is used as the training set. Frame c shows the 1-MBB results for the whole IRDC map, where the location of the training map is indicated with a dashed box in the upper left corner. Frames b and d shows the corrected τ maps for the training set and for the full 1875 × 1875 pixel map, respectively. The lower frames include histograms of the τ/τ0 values with their mean and standard deviation values.
Current usage metrics show cumulative count of Article Views (full-text article views including HTML views, PDF and ePub downloads, according to the available data) and Abstracts Views on Vision4Press platform.
Data correspond to usage on the plateform after 2015. The current usage metrics is available 48-96 hours after online publication and is updated daily on week days.
Initial download of the metrics may take a while.