Fig. 16
Download original image
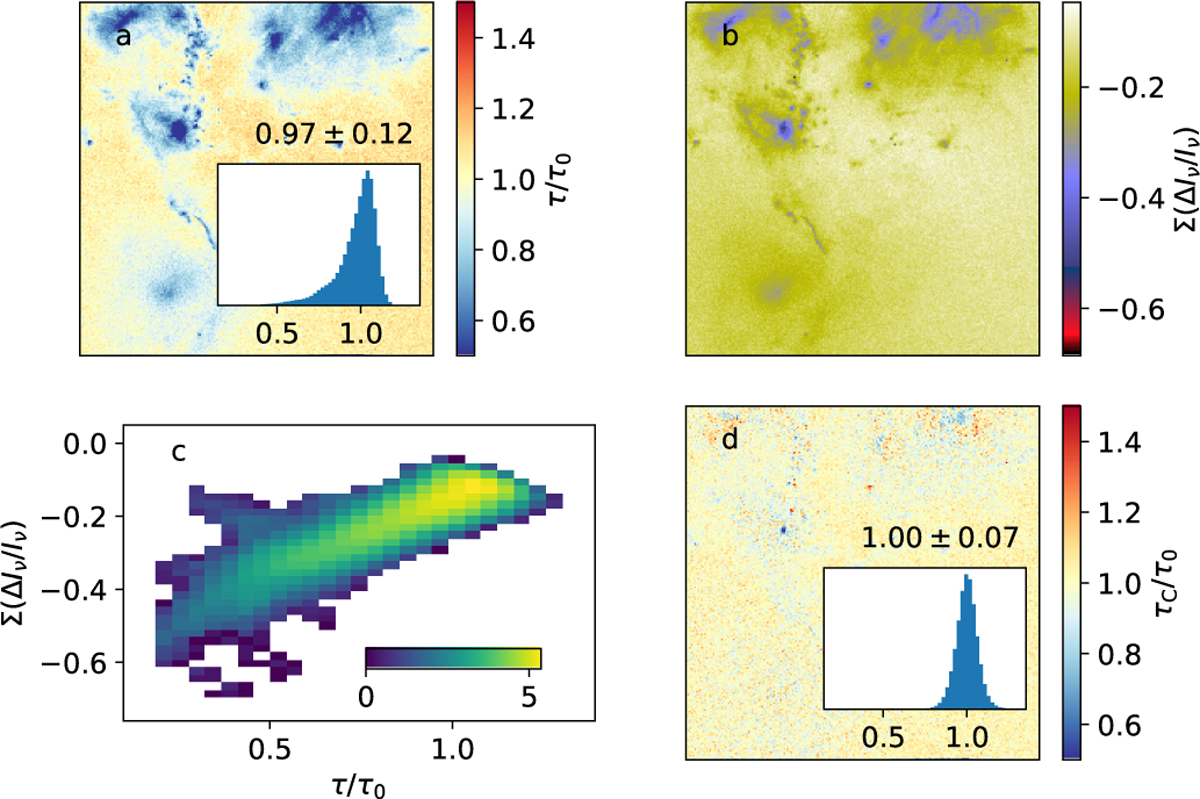
Empirical correction of the 1-MBB optical depth estimates of the IRDC cloud model. Frame a shows the ratio τ/τ0 between the original estimates and the true optical depths. Frame b shows the quantity Σ(ΔIv/Iv) that characterises the difference between each observed spectrum and the 1-MBB fit. Frame c shows the correlation between this quantity and the τ error, and Frame d shows the τ/τ0 ratio corrected for the trend in frame c. In frames a and d, the inserts show histograms of the τ/τ0 values (with linear y-axis). In frame c, the colour scale corresponds to logarithmic point density.
Current usage metrics show cumulative count of Article Views (full-text article views including HTML views, PDF and ePub downloads, according to the available data) and Abstracts Views on Vision4Press platform.
Data correspond to usage on the plateform after 2015. The current usage metrics is available 48-96 hours after online publication and is updated daily on week days.
Initial download of the metrics may take a while.