Fig. 15
Download original image
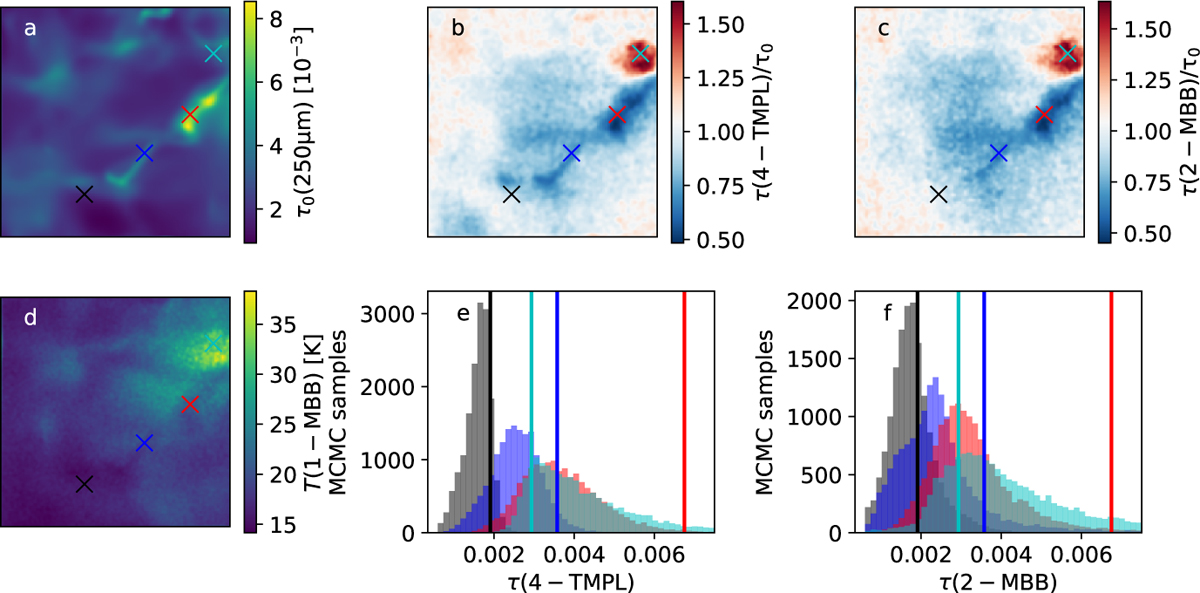
IRDC model observations fitted with MCMC methods. Frame a shows the true τ(250 μm) optical depths, and frame d the colour temperature from the 1-MBB fit. Frames b and c show the τ maps from the 4-TMPL and 2-MBB fits (averages over the MCMC samples) divided by the true optical depth τ0. Frames e and f show the posterior probability distributions for the four positions marked in the b and c frames, and the true values τ0 are indicated with vertical lines of the same colour (black, blue, red, and cyan).
Current usage metrics show cumulative count of Article Views (full-text article views including HTML views, PDF and ePub downloads, according to the available data) and Abstracts Views on Vision4Press platform.
Data correspond to usage on the plateform after 2015. The current usage metrics is available 48-96 hours after online publication and is updated daily on week days.
Initial download of the metrics may take a while.