Fig. 14
Download original image
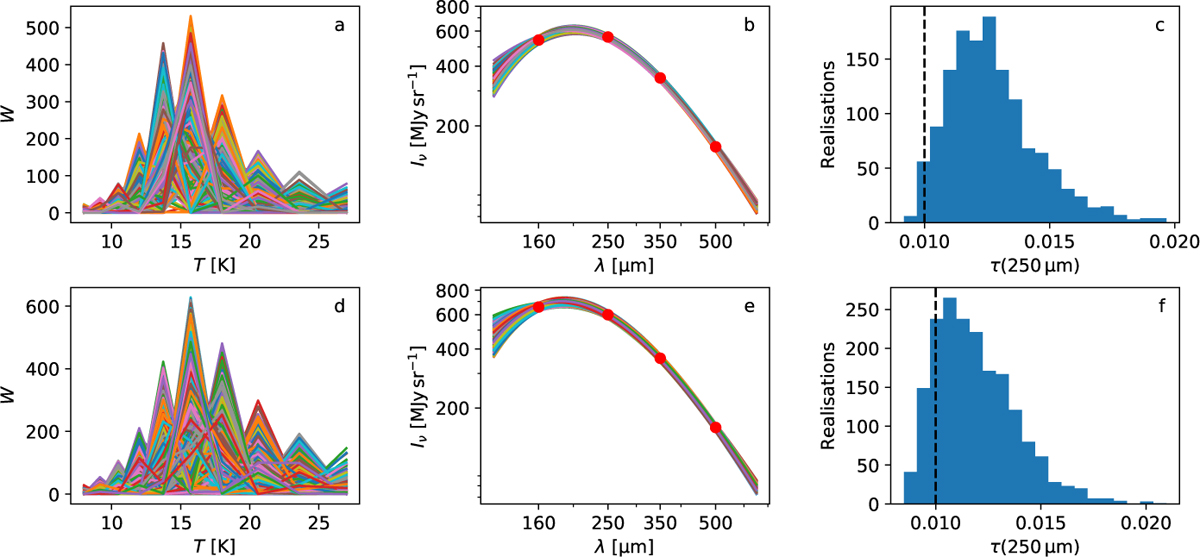
Fits to simulated observations with a 10-TMPL model. The observations consist of 160, 250, 350, and 500 μm intensities for a single Τ = 15 Κ MBB function (upper frames) or a sum of 13 Κ and 17 Κ components of equal optical depth (red circles in frames b and e). Frames a and d show random realisations of the combinations of weights W that result in less than 5% errors for all four predicted intensities (curves in frames b and e). The frames c and f show the distributions of the τ values predicted by those fits. The true optical depth is τ(250 μm) = 0.01.
Current usage metrics show cumulative count of Article Views (full-text article views including HTML views, PDF and ePub downloads, according to the available data) and Abstracts Views on Vision4Press platform.
Data correspond to usage on the plateform after 2015. The current usage metrics is available 48-96 hours after online publication and is updated daily on week days.
Initial download of the metrics may take a while.