Fig. 12
Download original image
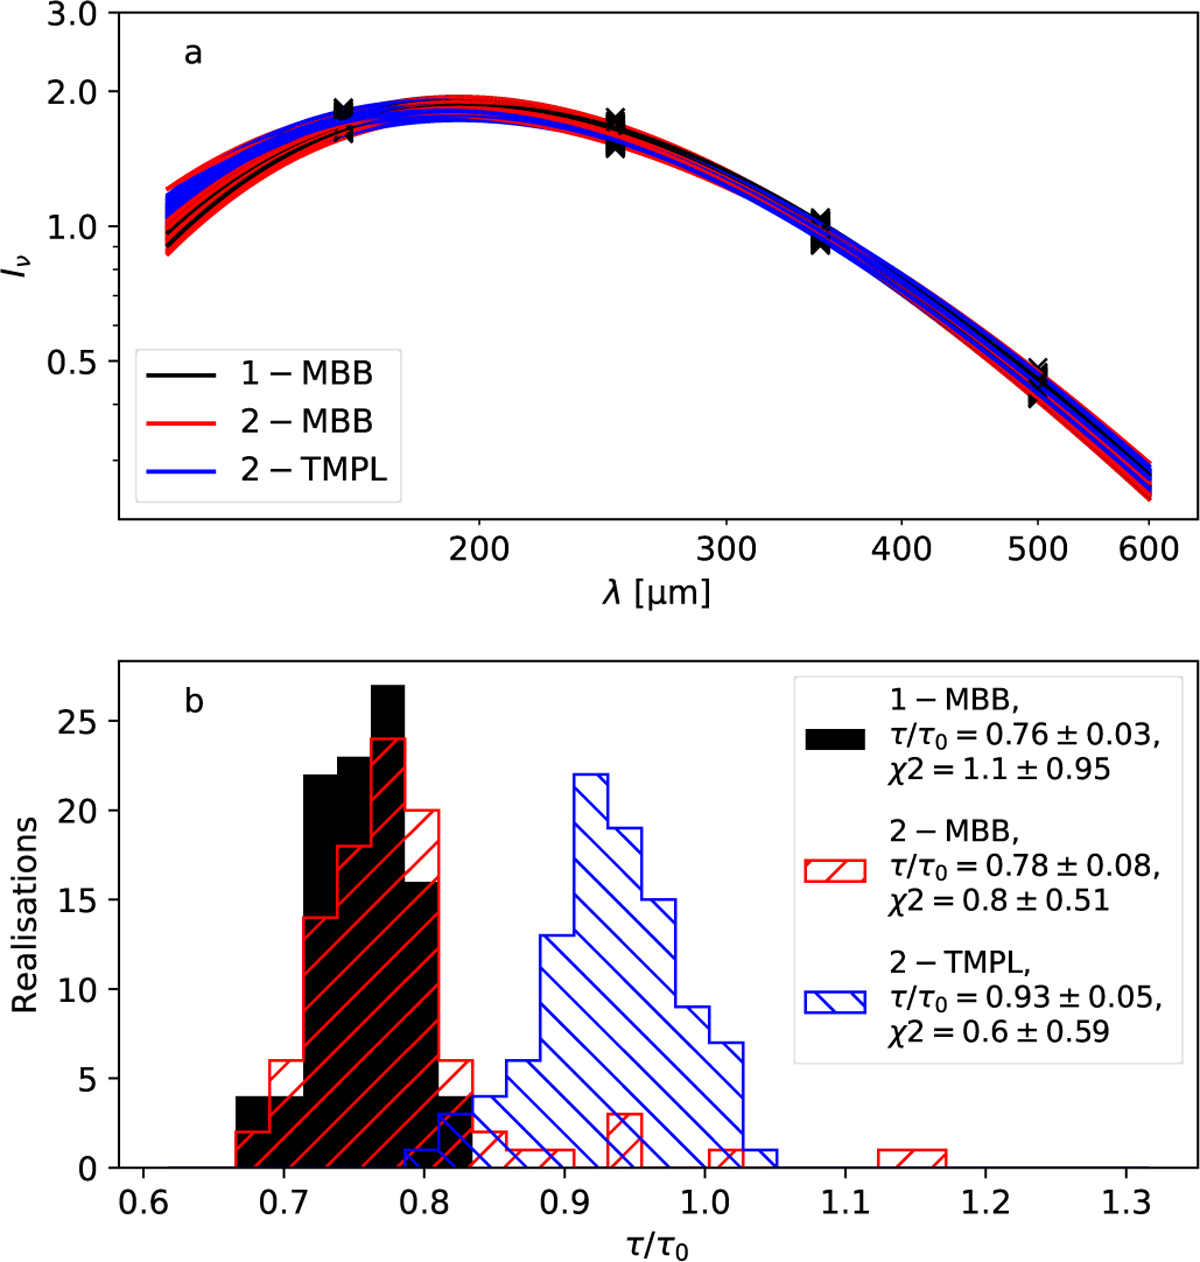
Results from the fitting different noise realisations of the Fig. 11 observations. Frame a shows a few examples of the observations (black crosses) and individual fits (solid curves). Frame b–d show the distributions of τ estimates (100 noise realisations) for the 1-MBB, 2-MBB, and 3-MBB models, respectively. Each frame quotes the mean value and the standard deviation for the estimates relative to the true value, τ/τ0.
Current usage metrics show cumulative count of Article Views (full-text article views including HTML views, PDF and ePub downloads, according to the available data) and Abstracts Views on Vision4Press platform.
Data correspond to usage on the plateform after 2015. The current usage metrics is available 48-96 hours after online publication and is updated daily on week days.
Initial download of the metrics may take a while.