Fig. 10
Download original image
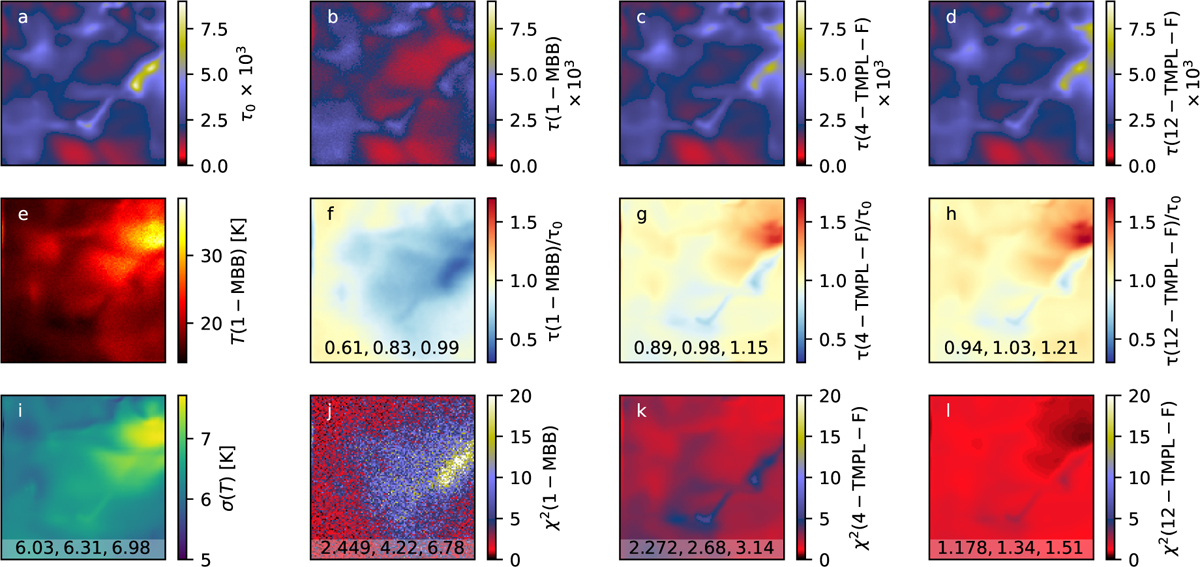
IRDC observations fitted in Fourier space. Frame a shows the true optical depth and frame e the colour temperature from the 1-MBB fit. Frames b–d show the optical depths estimated with the 1-MBB, 4-TMPL, and 12-TMPL fits, respectively. The corresponding ratios of estimated and true optical depths are shown in frames f-h and the χ2 values in frames j-l. Frame i shows the standard deviation of the temperature values from the 12-TMPL fit. The values quoted in the frames are the 10%, 50%, and 90% percentiles of the plotted quantity. The maps cover the same 256 × 256 pixel area as in Fig. 8.
Current usage metrics show cumulative count of Article Views (full-text article views including HTML views, PDF and ePub downloads, according to the available data) and Abstracts Views on Vision4Press platform.
Data correspond to usage on the plateform after 2015. The current usage metrics is available 48-96 hours after online publication and is updated daily on week days.
Initial download of the metrics may take a while.