Fig. 1
Download original image
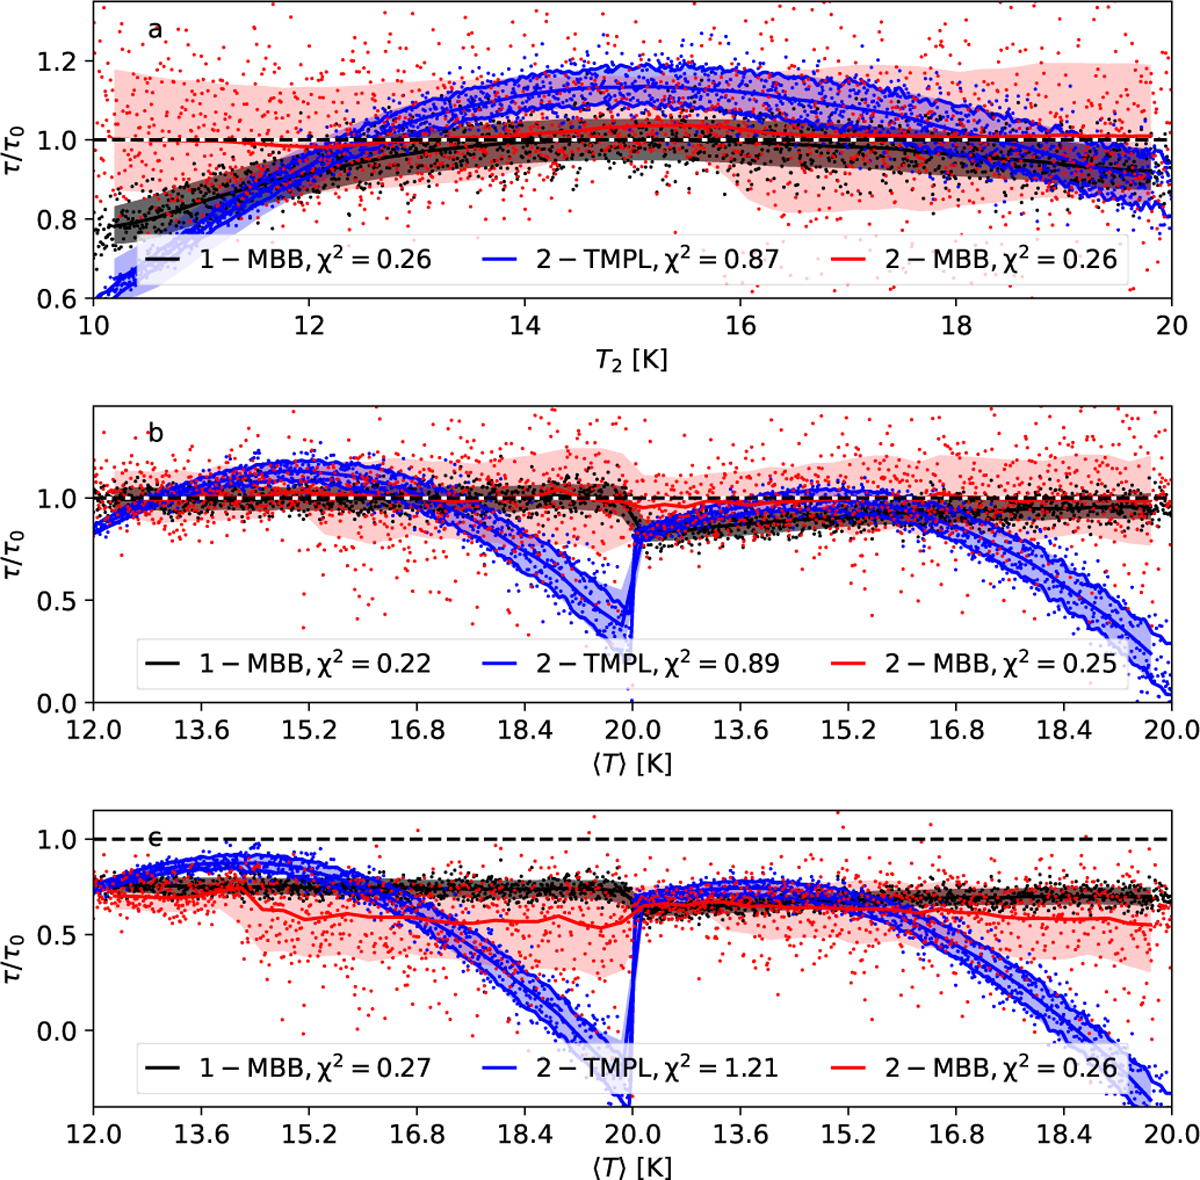
Ratio of estimated and true optical depths τ/τ0 for 1-MBB, 2-TMPL (TC=13 K and 17 K), and 2-MBB models. The observations consist of 160, 250, 350, and 500 μm intensities with 3% relative noise. The dots correspond to individual pixels (every 10th pixel), the solid lines show moving averages, and the shaded regions the 1-σ dispersion of the τ estimates. The χ1 values of the ML fits (normalised by the number of fitted data points) are quoted in the frames. In frame a, observations consist of one emission component at T1 = 15 K and one component varied in the range T2 = 10–20 K (on x-axis), both with the same optical depth. The additional solid blue lines correspond to the 1-σ error estimates from the MCMC fit of the 2-TMPL model. In frame b, the observations correspond to a continuous temperature distribution, T ~ N(〈T〉, σT). The x-axis shows the 〈T〉 value, with σT = 1 K for the first and σT = 5 K for the second half. Frame c is the same as frame b but the SED fits assuming β = 1.7 instead of the correct value of β = 1.9.
Current usage metrics show cumulative count of Article Views (full-text article views including HTML views, PDF and ePub downloads, according to the available data) and Abstracts Views on Vision4Press platform.
Data correspond to usage on the plateform after 2015. The current usage metrics is available 48-96 hours after online publication and is updated daily on week days.
Initial download of the metrics may take a while.