Fig. 9
Download original image
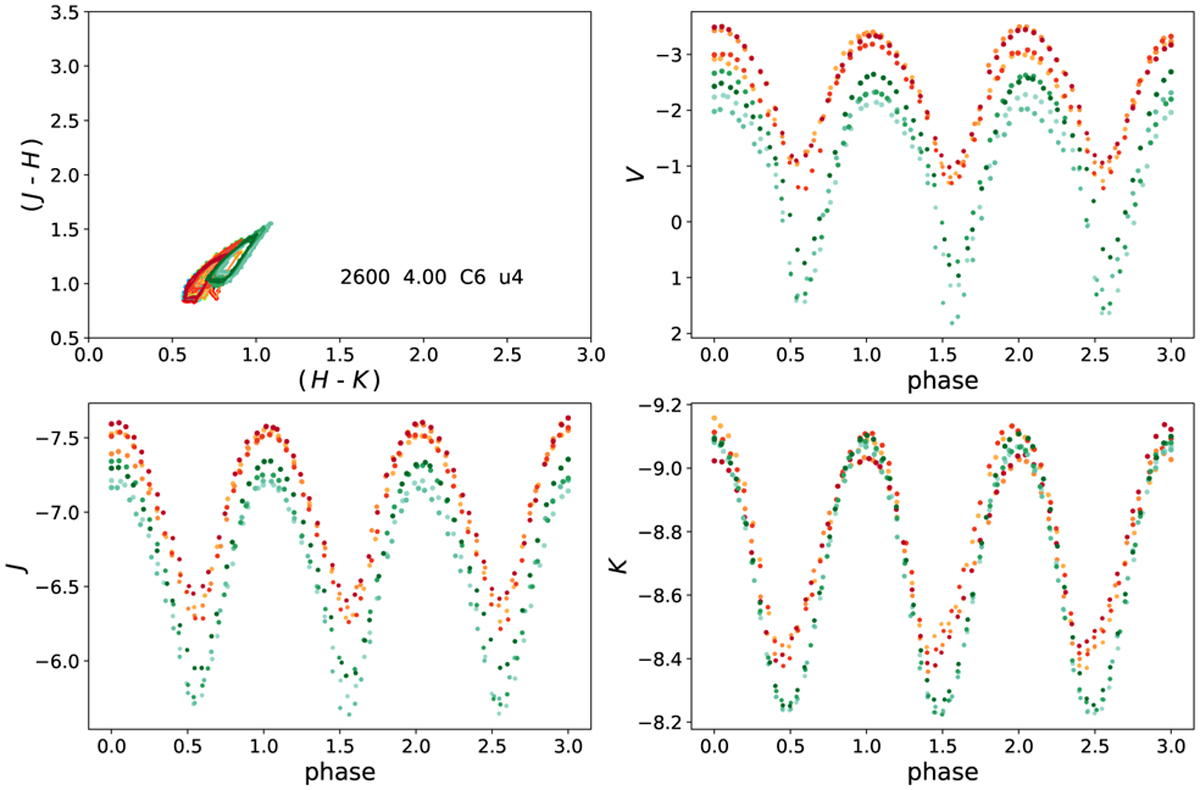
Photometrie variations of the models shown in the top row of Fig. 5. The (J–H) versus (H–K) diagram (top left) and the light curves of the V (top right), J (bottom left), and K (bottom right) magnitudes for three periods in several epochs. The SDDO values are plotted in orange-red hues, and the SPL values are plotted in blue-ones. The model has the parameters Teff = 2600 K, log L = 4.0 L⊙, mass 1.5 M⊙, log(C–O) = 8.5, and a piston amplitude of 4 km s−1.
Current usage metrics show cumulative count of Article Views (full-text article views including HTML views, PDF and ePub downloads, according to the available data) and Abstracts Views on Vision4Press platform.
Data correspond to usage on the plateform after 2015. The current usage metrics is available 48-96 hours after online publication and is updated daily on week days.
Initial download of the metrics may take a while.