Fig. 3
Download original image
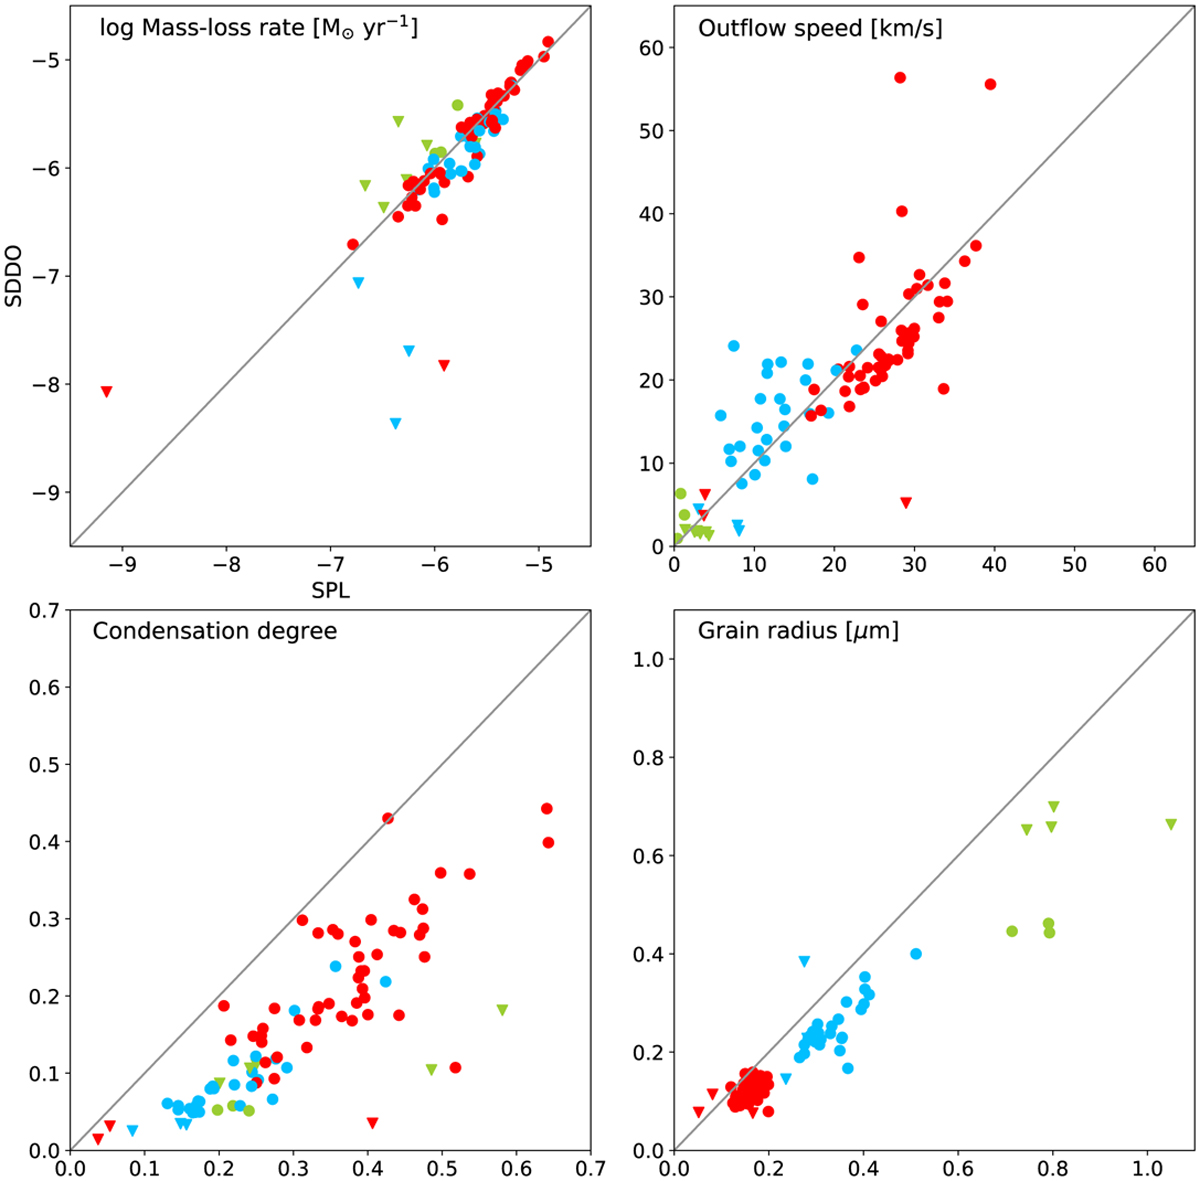
Comparison of different properties of SDDO versus SPL grids. The quantities plotted are mass-loss rates (upper left), outflow speeds (upper right), condensation degrees (lower left) and dust grain radii (lower right). The different carbon excesses are shown in colour: log(C-O) = 8.2 in green, 8.5 in blue, and 8.8 in red. Circles denote wind models and triangles denote episodic models.
Current usage metrics show cumulative count of Article Views (full-text article views including HTML views, PDF and ePub downloads, according to the available data) and Abstracts Views on Vision4Press platform.
Data correspond to usage on the plateform after 2015. The current usage metrics is available 48-96 hours after online publication and is updated daily on week days.
Initial download of the metrics may take a while.