Fig. A.4
Download original image
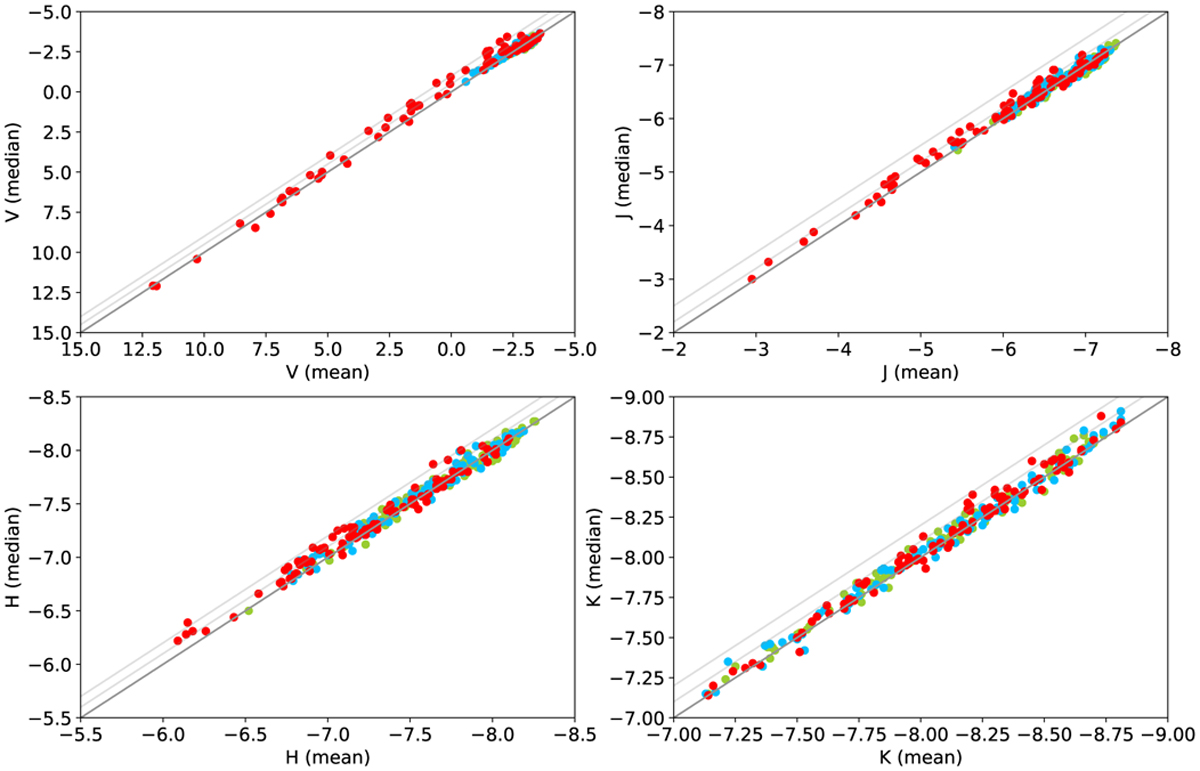
Median magnitudes versus mean magnitudes plotted for models in the SDDO grid. The different panels show the effects in the V, J, H, and K filters. The models are colour-coded according to their carbon excess (see Fig. 6). Offsets from the one-to-one line of 0.5 and 1.0 (in V), 0.2 and 0.5 (in J), and 0.1 and 0.2 (in H and K) are indicated by the grey lines.
Current usage metrics show cumulative count of Article Views (full-text article views including HTML views, PDF and ePub downloads, according to the available data) and Abstracts Views on Vision4Press platform.
Data correspond to usage on the plateform after 2015. The current usage metrics is available 48-96 hours after online publication and is updated daily on week days.
Initial download of the metrics may take a while.