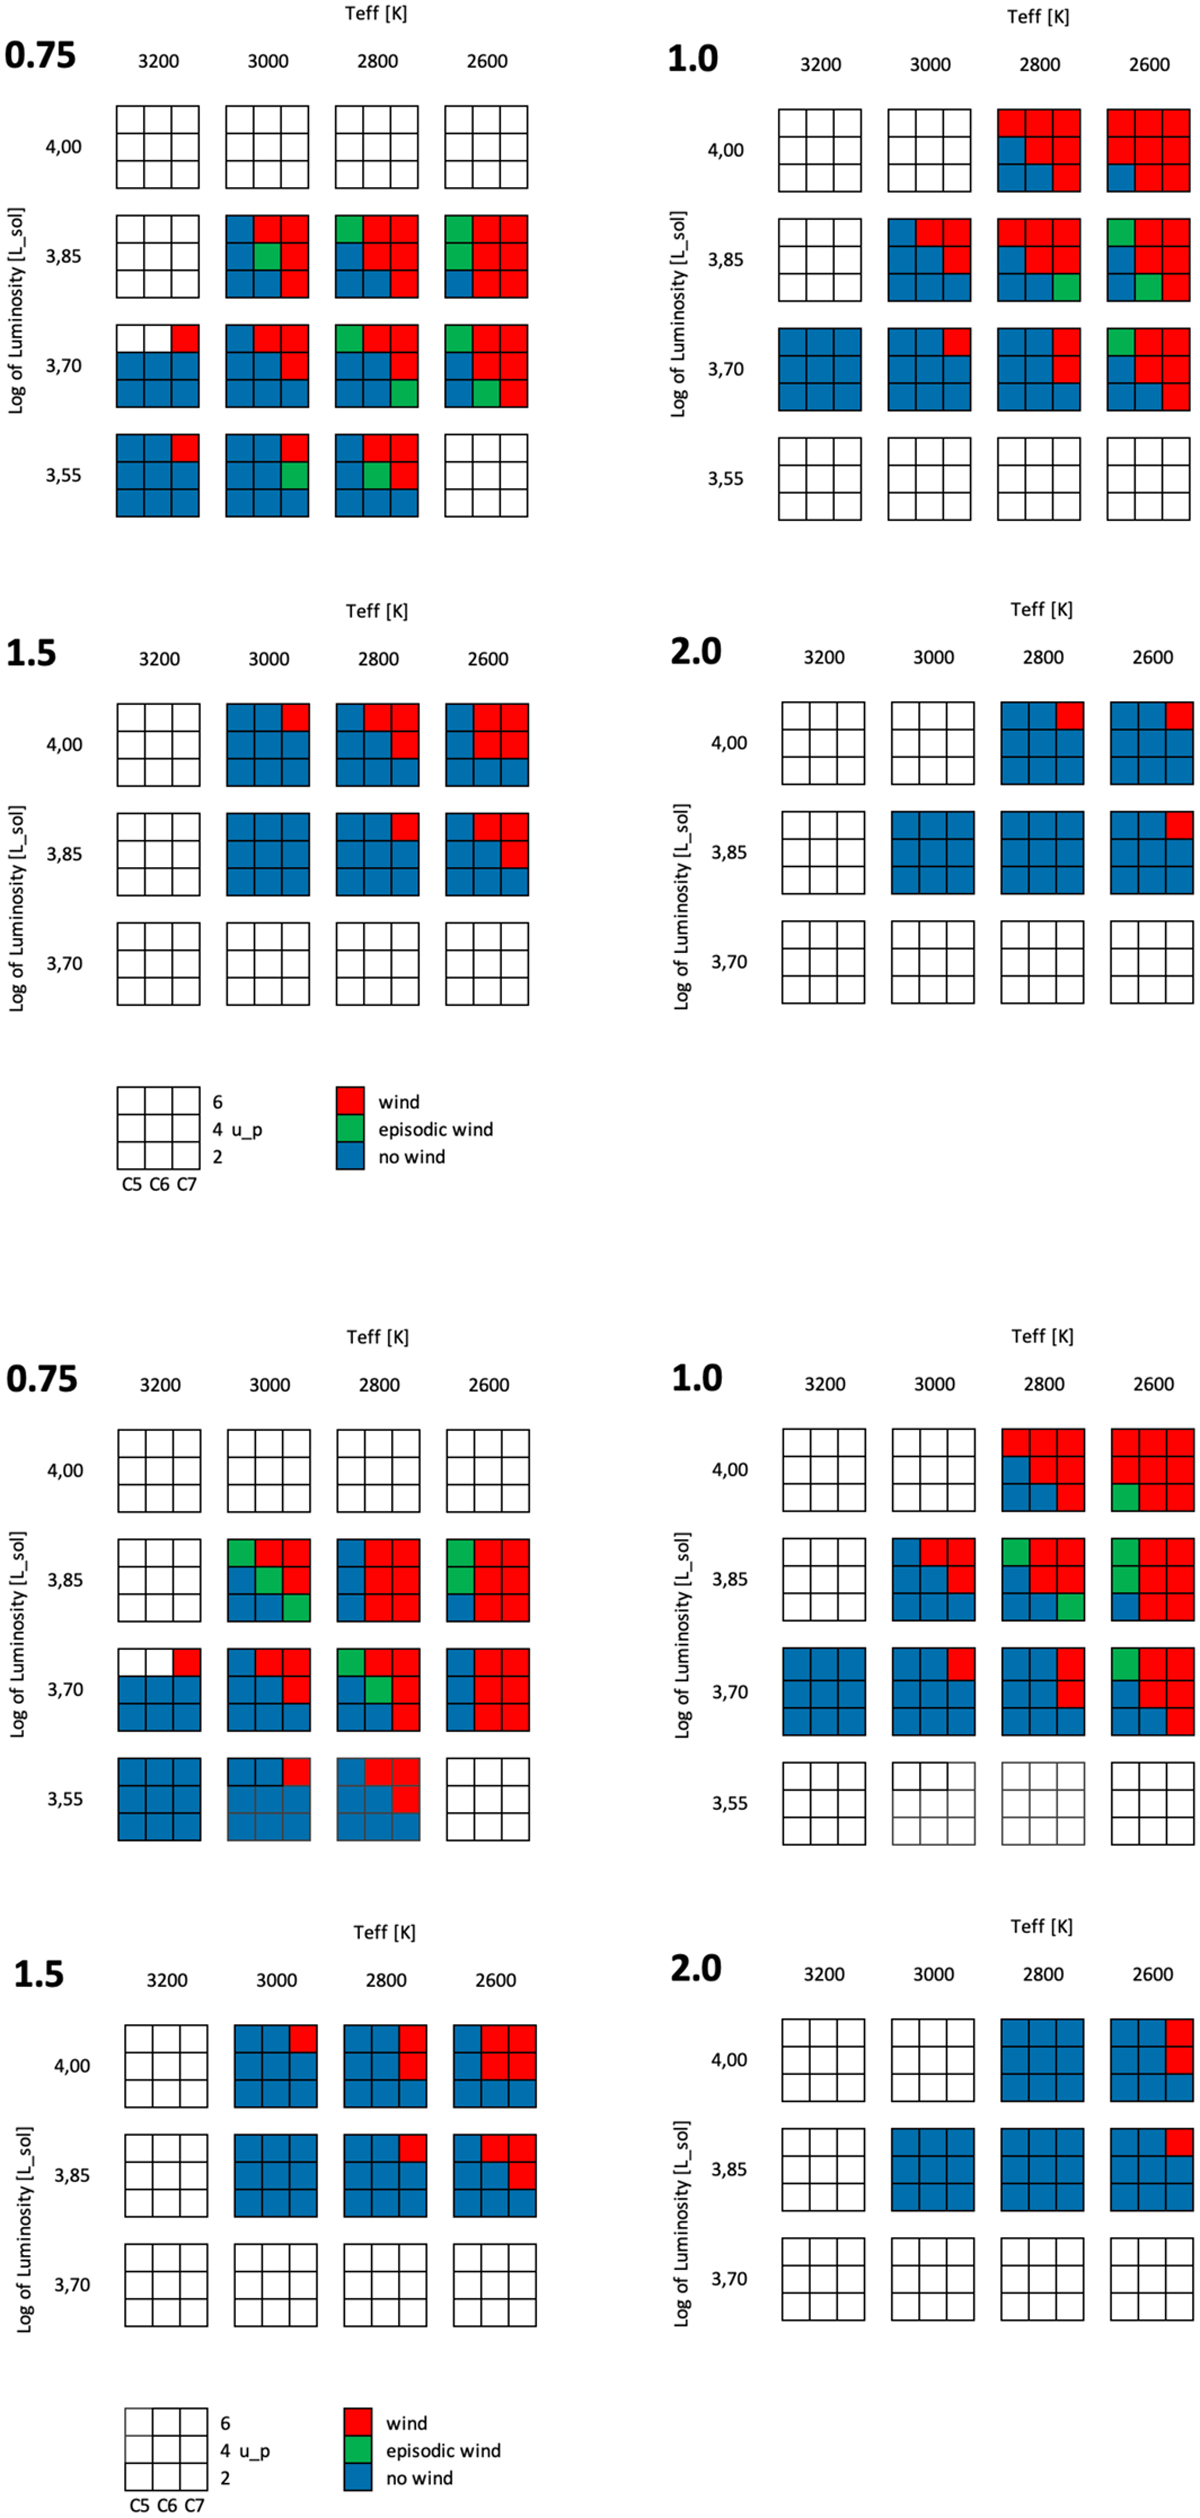
Fig. 2
Download original image
Dynamic behaviour of models these are also referred to as wind-maps. In an HR-type display, the models are colour-coded as red for wind, blue for no wind, and green for episodic behaviour. The upper four panels show the SDDO case and the lower four show the grid with the SPL approximation. The four sub-panels for each grid show models of different stellar masses indicated in the top left corner. For each given combination of temperature and luminosity, the different carbon excesses and piston amplitudes are arranged as shown in the bottom legend.
Current usage metrics show cumulative count of Article Views (full-text article views including HTML views, PDF and ePub downloads, according to the available data) and Abstracts Views on Vision4Press platform.
Data correspond to usage on the plateform after 2015. The current usage metrics is available 48-96 hours after online publication and is updated daily on week days.
Initial download of the metrics may take a while.