Open Access
Fig. 17
Download original image
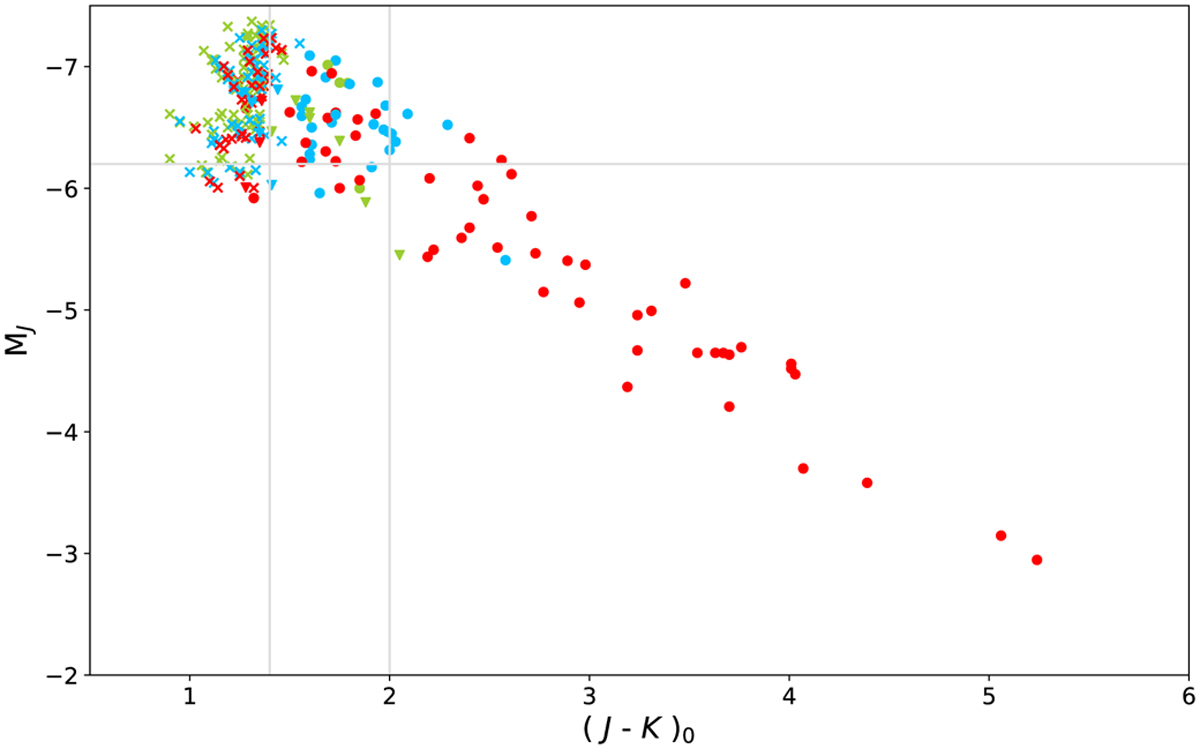
MJ values versus mean (J–K)0 colour for the SDDO models in the entire grid. Colours and symbols are explained in Fig. 6. The value of MJ = −6.2 is marked, as well as (J–K)0 = 1.4 and 2.0.
Current usage metrics show cumulative count of Article Views (full-text article views including HTML views, PDF and ePub downloads, according to the available data) and Abstracts Views on Vision4Press platform.
Data correspond to usage on the plateform after 2015. The current usage metrics is available 48-96 hours after online publication and is updated daily on week days.
Initial download of the metrics may take a while.