Fig. A.1
Download original image
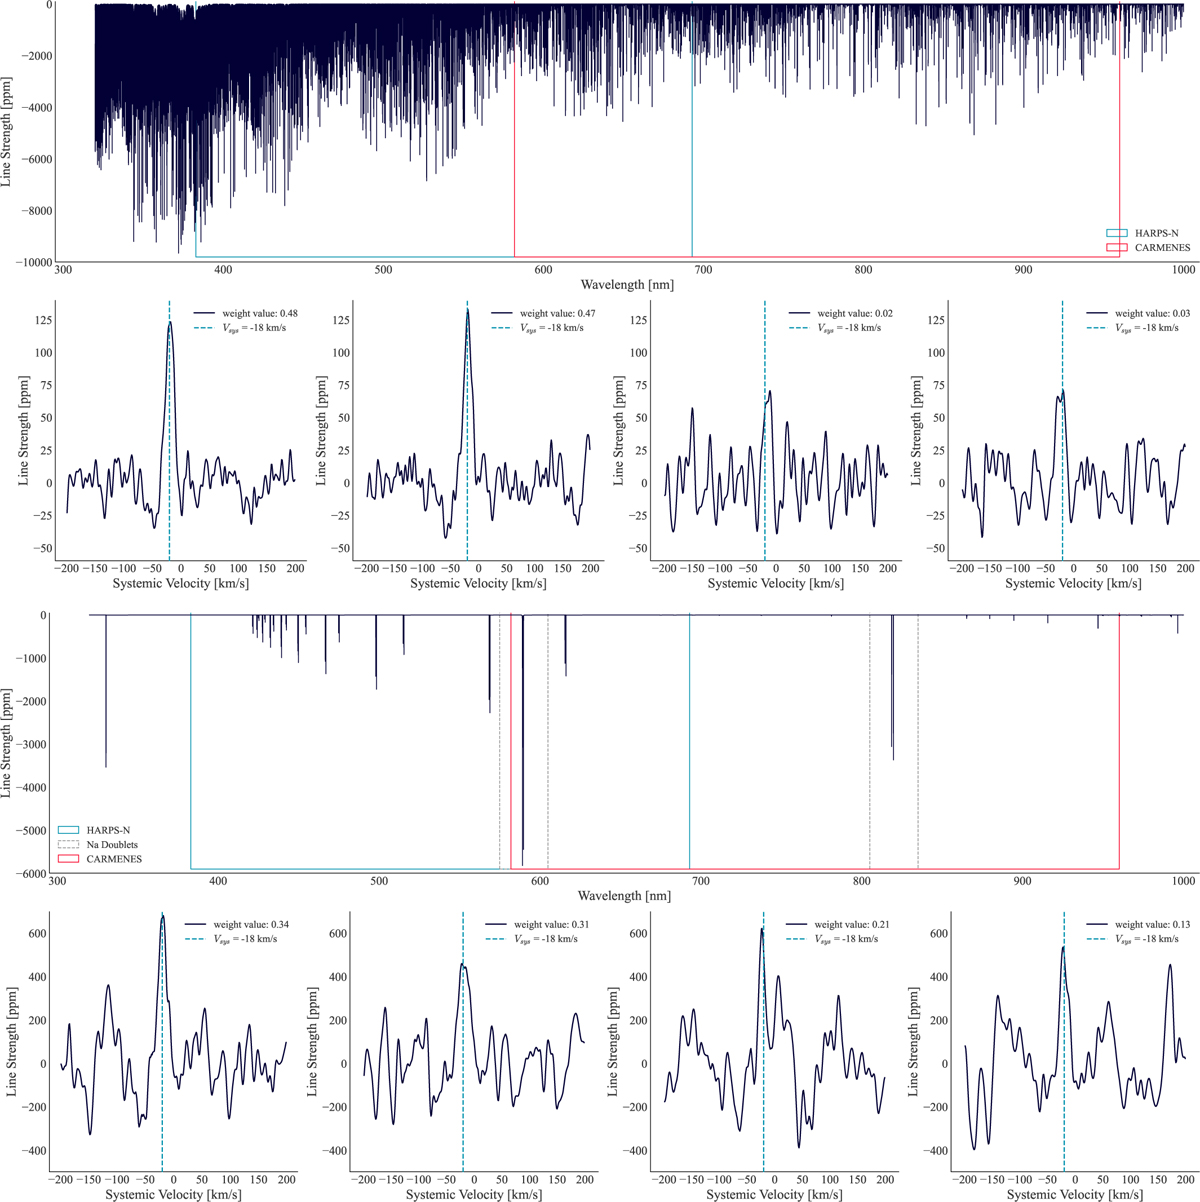
Summary of the weight extraction process. The first two rows illustrate the weight construction for Fe I. Top panel: Line list of neutral iron used for cross-correlation. The wavelength ranges of the HARPS-N and CARMENES visible are plotted in boxes to illustrate the difference in wavelength coverage. Bottom panel: 1D cross-correlation functions for the four nights of observations. The two HARPS-N nights have much higher SNR and contain less background noise, producing larger weights than the CARMENES observations. The second two rows demonstrate the weight constructions for Na I. Top panel: Line list for neutral sodium. The proportion of flux obtained by both spectrographs is comparable to each other, therefore data quality dominates the weight calculation when combined. Bottom panel: Cross-correlation functions for each night, CARMENES nights obtain a higher proportion in the calculation of weights.
Current usage metrics show cumulative count of Article Views (full-text article views including HTML views, PDF and ePub downloads, according to the available data) and Abstracts Views on Vision4Press platform.
Data correspond to usage on the plateform after 2015. The current usage metrics is available 48-96 hours after online publication and is updated daily on week days.
Initial download of the metrics may take a while.