Fig. 8
Download original image
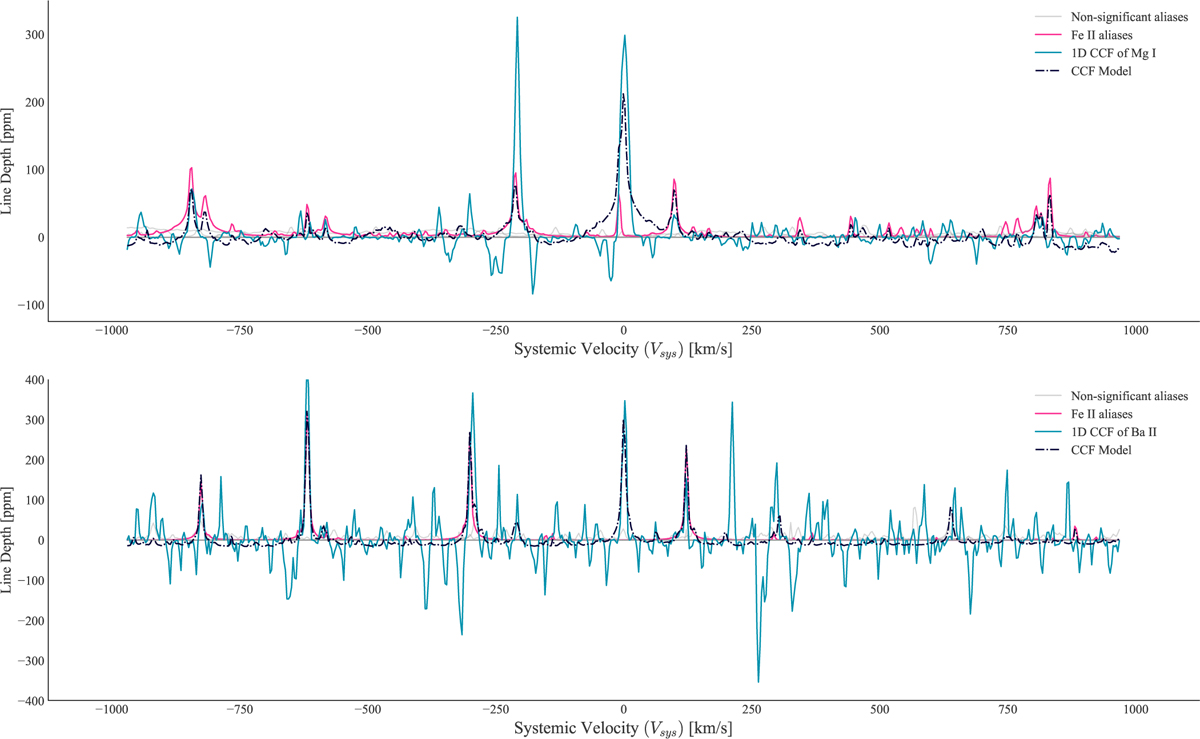
Expected aliases for the 1D cross-correlation function for Mg I, those with a < 3σ coefficient significance are plotted in grey. The measured 1D cross-correlation function is shown in teal, and the model fit in dashed-black. The significant alias structure of Fe II is plotted in pink, and clearly contributes to the 1D cross-correlation function. The remaining predicted non-significant aliases is shown in grey.
Current usage metrics show cumulative count of Article Views (full-text article views including HTML views, PDF and ePub downloads, according to the available data) and Abstracts Views on Vision4Press platform.
Data correspond to usage on the plateform after 2015. The current usage metrics is available 48-96 hours after online publication and is updated daily on week days.
Initial download of the metrics may take a while.