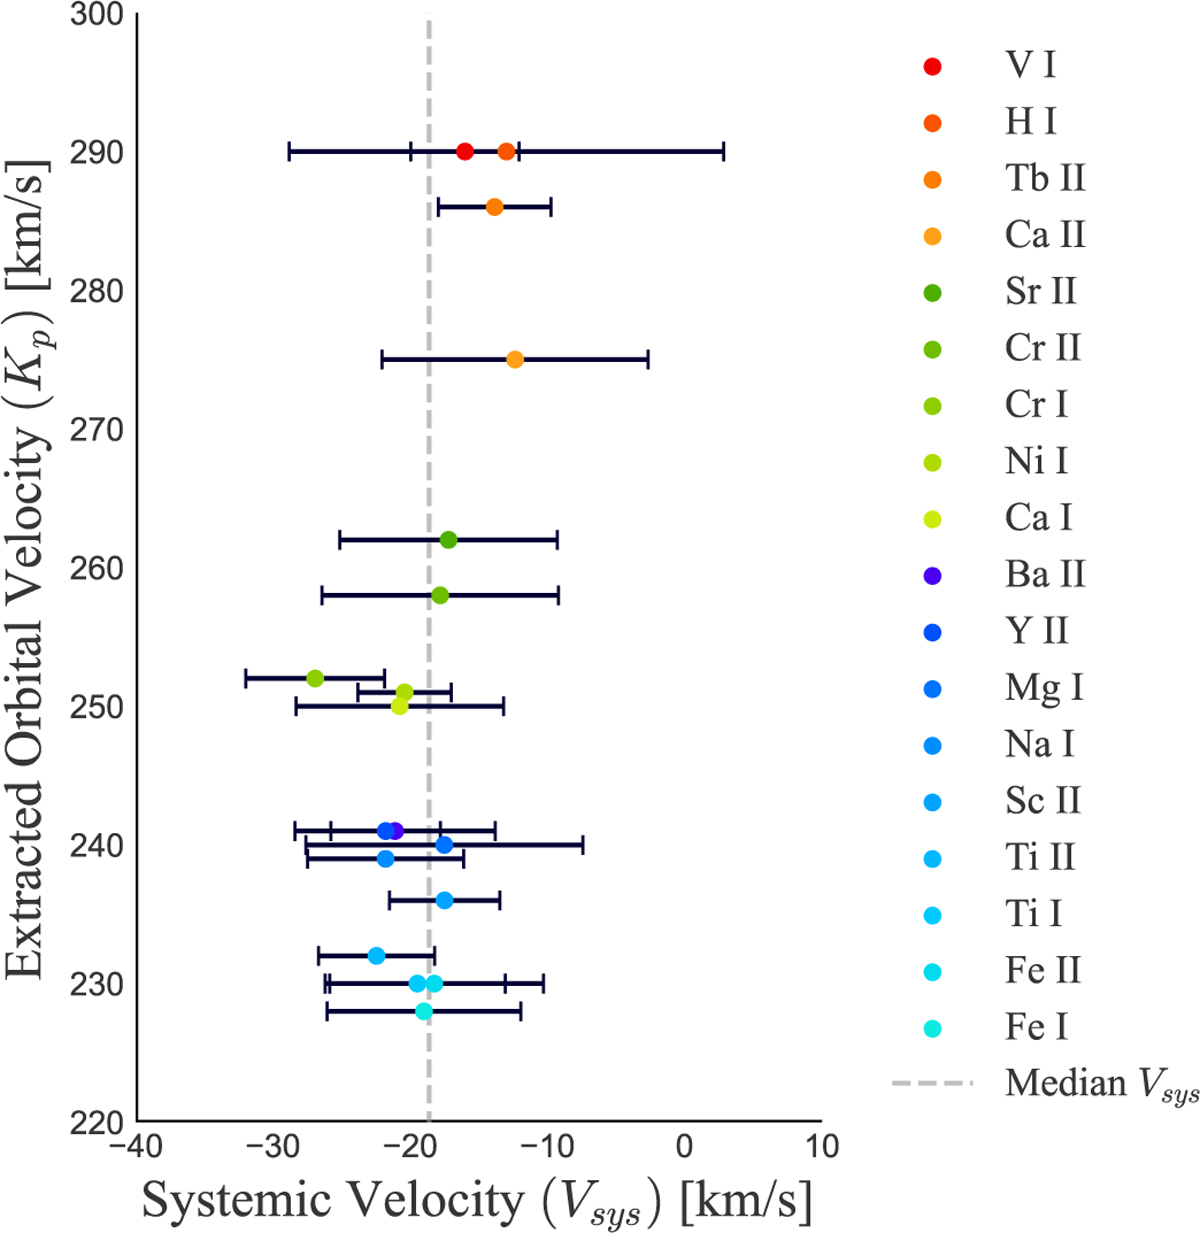
Fig. 6
Download original image
Fitted Gaussian parameters for the systemic velocity centres and widths, obtained from the extracted orbital velocity from the Kp – Vsys plots. The detections appear to cluster into three groups, suggesting they may be probing different atmospheric layers, which have been colour-coded for easier identification. The median systemic velocity is represented by a grey line on the plot.
Current usage metrics show cumulative count of Article Views (full-text article views including HTML views, PDF and ePub downloads, according to the available data) and Abstracts Views on Vision4Press platform.
Data correspond to usage on the plateform after 2015. The current usage metrics is available 48-96 hours after online publication and is updated daily on week days.
Initial download of the metrics may take a while.