Open Access
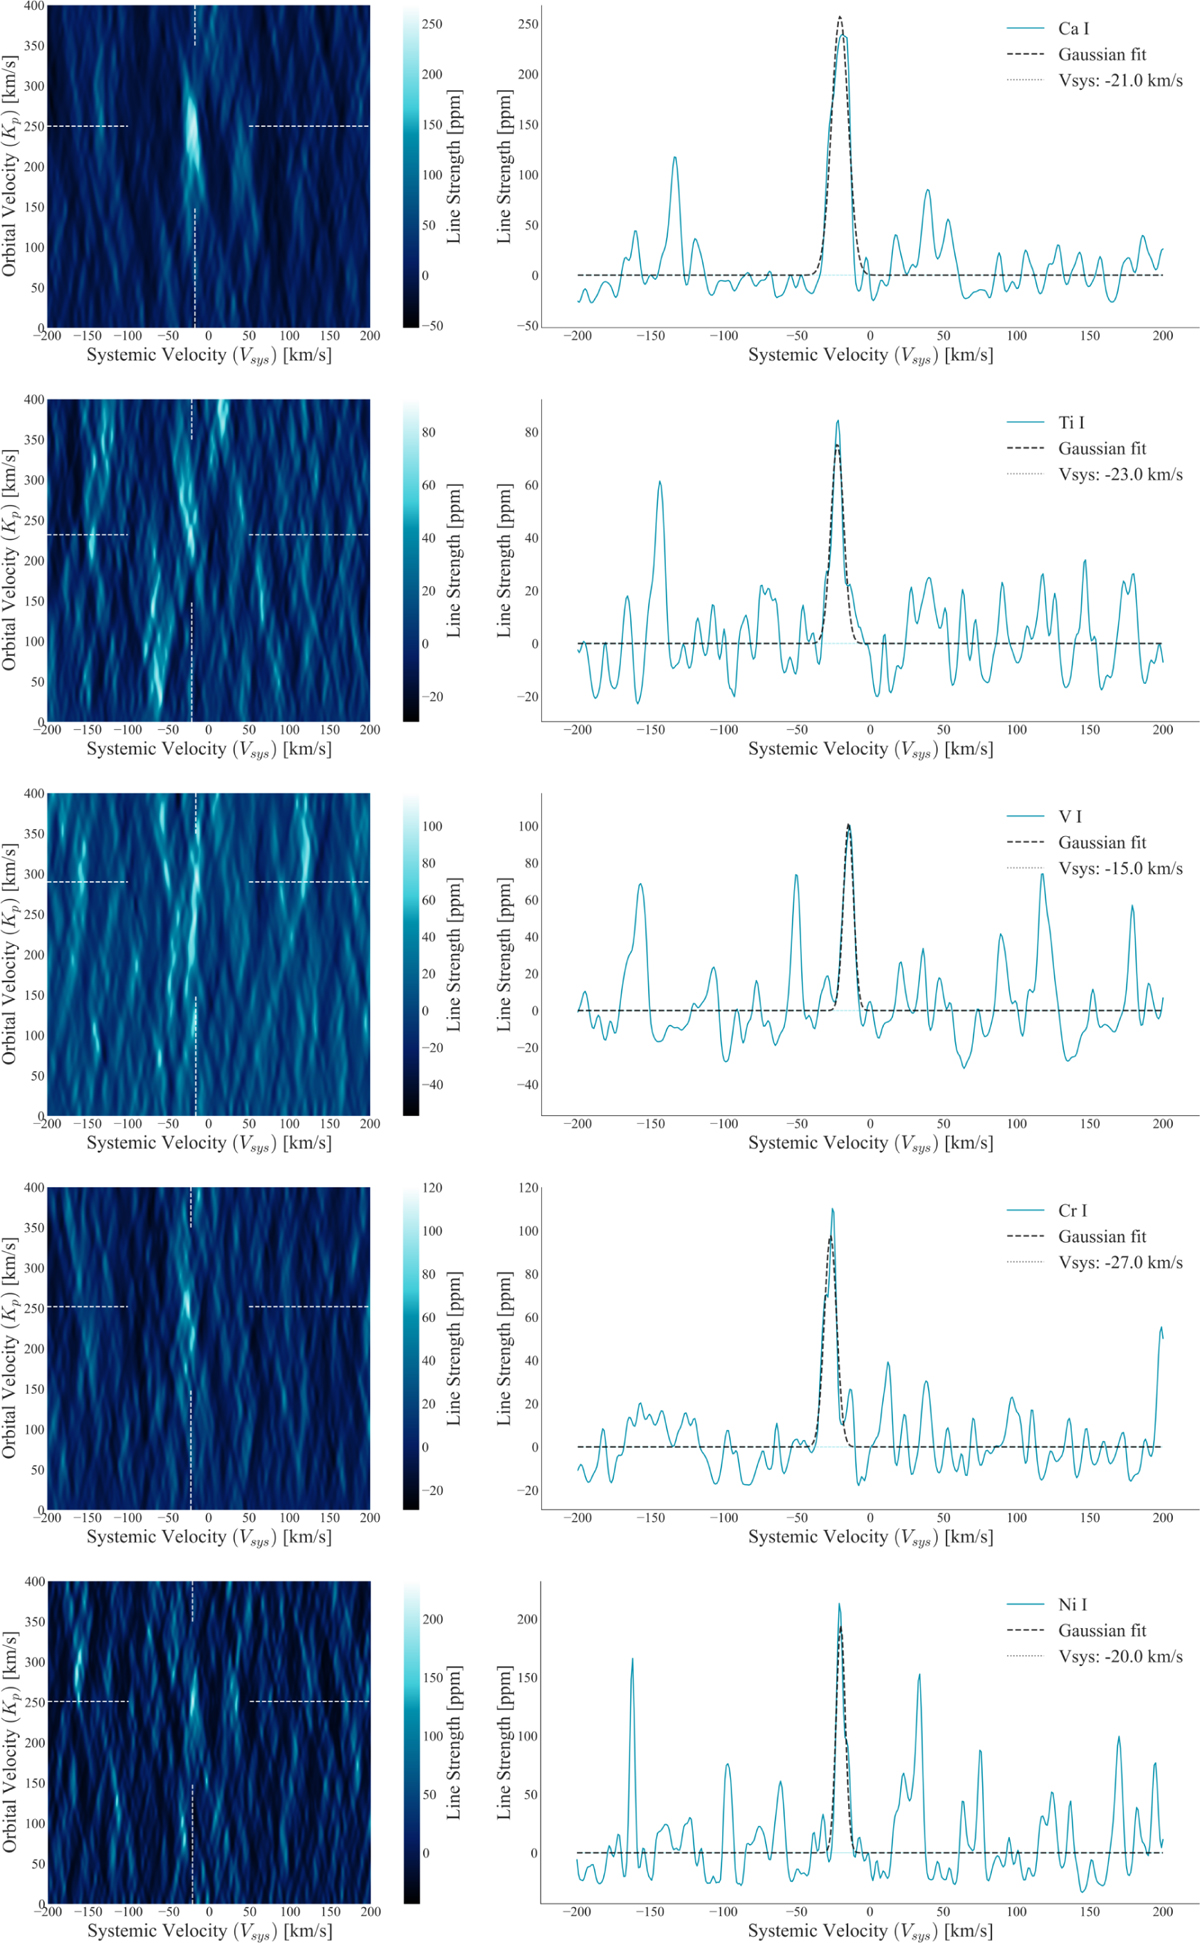
Fig. 5
Download original image
Newly detected species detections in KELT-9 b. Each panel presents each species’ 2D and 1D cross-correlation signatures in the following order: Ca I, V I, Cr I, Ni I, Sr II, Ba II, and Tb II. The plots are constructed in the same manner as Fig. 4.
This figure is made of several images, please see below:
Current usage metrics show cumulative count of Article Views (full-text article views including HTML views, PDF and ePub downloads, according to the available data) and Abstracts Views on Vision4Press platform.
Data correspond to usage on the plateform after 2015. The current usage metrics is available 48-96 hours after online publication and is updated daily on week days.
Initial download of the metrics may take a while.