Fig. 4
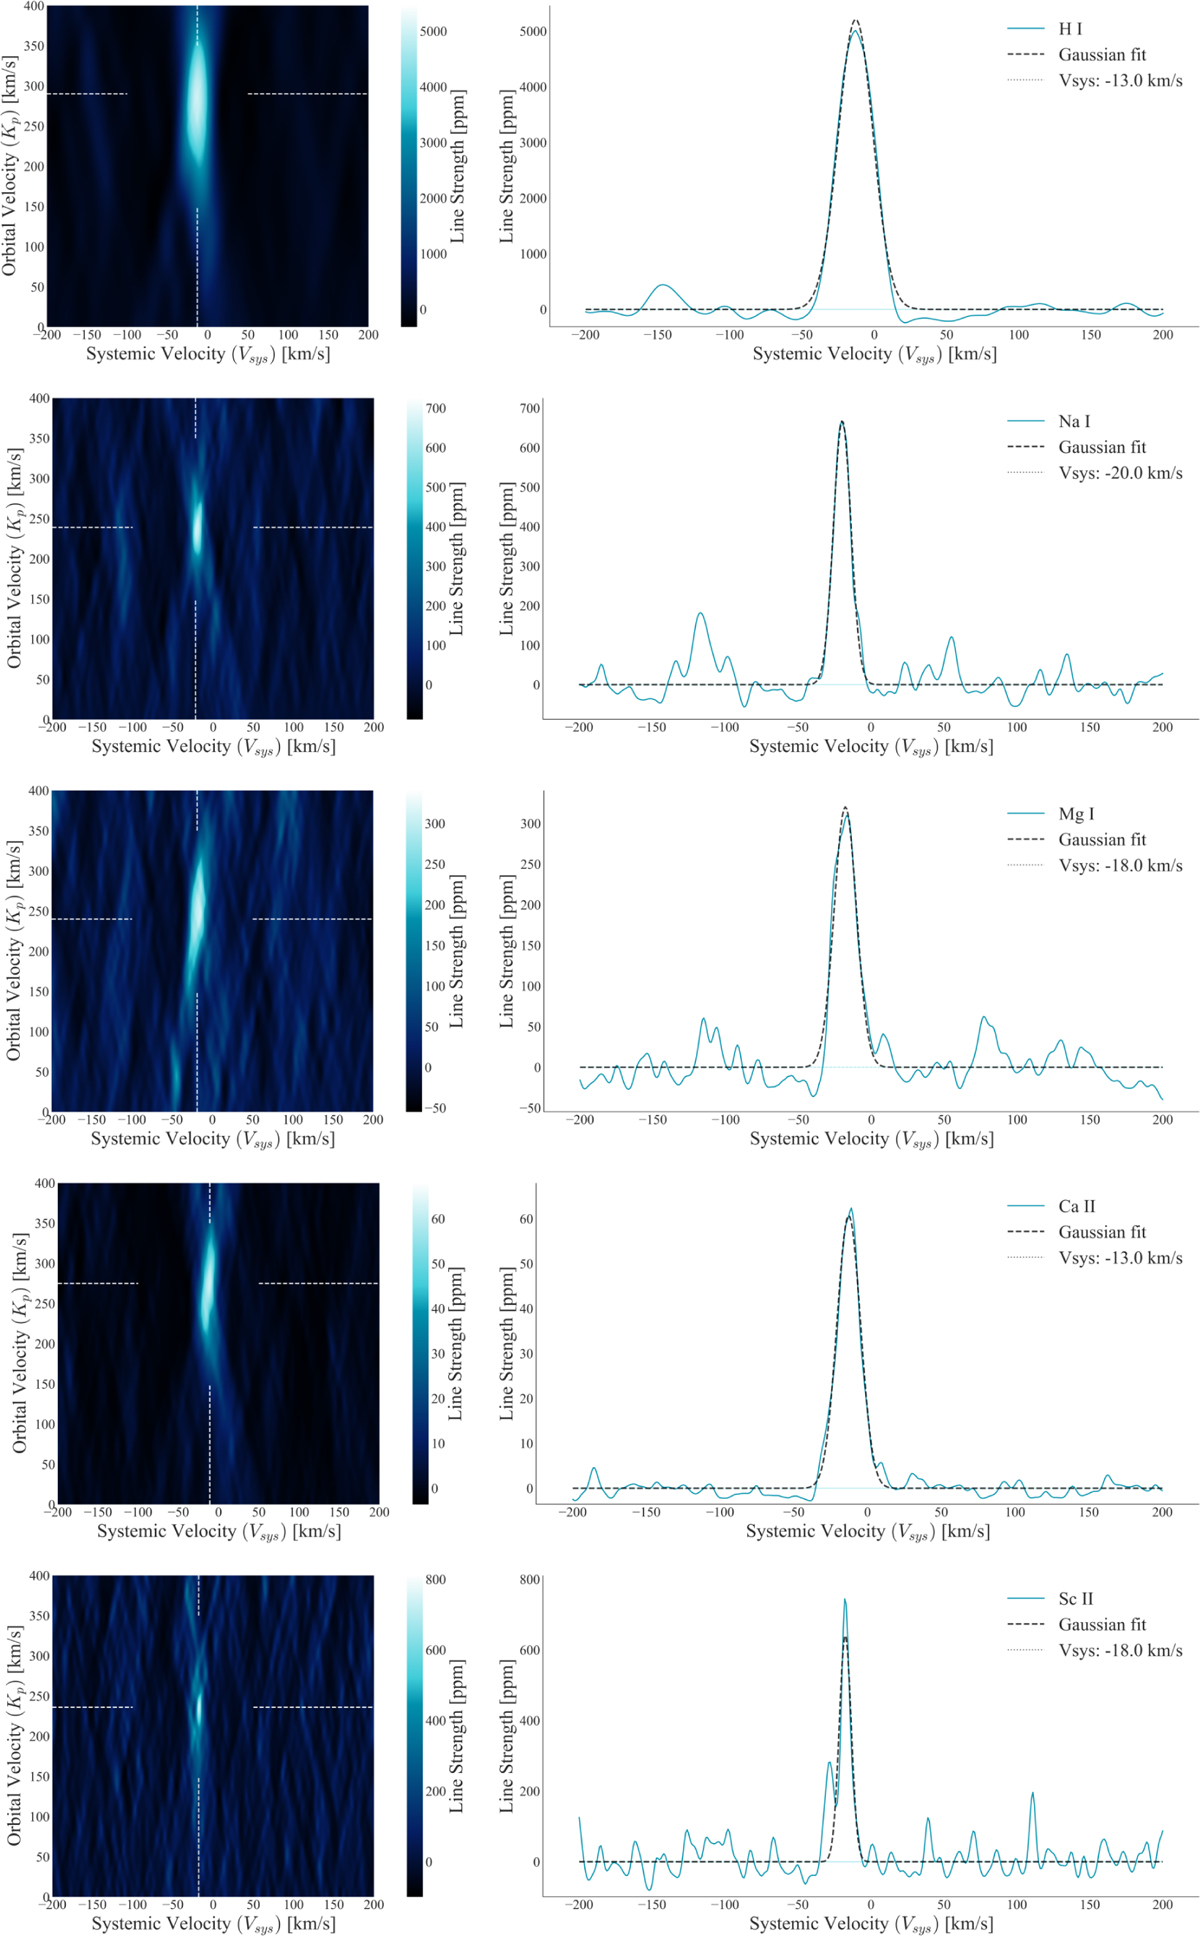
Download original image
Confirmed species detections in KELT-9 b. Each panel presents each species’ 2D and 1D cross-correlation signatures in the following order: H I, Na I, Mg I, Ca II, Sc II, Ti II, Cr II, Fe I, Fe II, and Y II. In the Kp – Vsys maps, the white dashed lines locate the maximum peak of the signal. One-dimensional cross-correlation functions are extracted from the Kp – Vsys map by selecting the row of pixels at the maximal location of the signal. The dashed dot represents a Gaussian fit to the cross-correlation function, and the vertical dotted lines mark the location of the peak for each example. The blue-shaded region represents the standard deviation of all points away from the peak of each function.
Current usage metrics show cumulative count of Article Views (full-text article views including HTML views, PDF and ePub downloads, according to the available data) and Abstracts Views on Vision4Press platform.
Data correspond to usage on the plateform after 2015. The current usage metrics is available 48-96 hours after online publication and is updated daily on week days.
Initial download of the metrics may take a while.