Fig. 3
Download original image
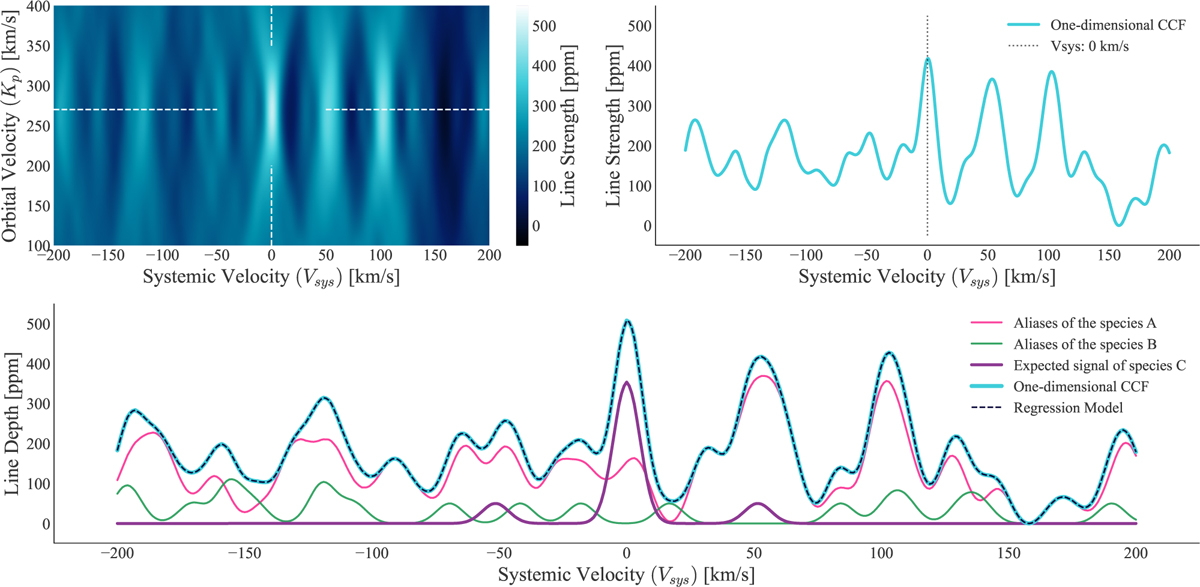
Cross-correlation results from correlating species C with Species A, Species B, and the whole toy spectrum. Top left panel: the generated Kp – Vsys map using the toy spectrum. In the absence of noise, clear signals occur at the same orbital velocity but various systemic velocities, which cannot be related to the search species signal. Top right panel: the extracted 1D CCF, while a peak has formed at the expected location of the signal, the resulting cross-correlation function is highly structured with two large peaks forming close to 50 km s−1 and 100 km s−1. Bottom panel: the decomposition of the 1D cross-correlation into its signal and alias components, we see that species A is largely responsible for the signal structure away from the planet’s signal, including the two offset peaks. The regression model specified in Eq. (8) has successfully reconstructed the 1D cross-correlation function.
Current usage metrics show cumulative count of Article Views (full-text article views including HTML views, PDF and ePub downloads, according to the available data) and Abstracts Views on Vision4Press platform.
Data correspond to usage on the plateform after 2015. The current usage metrics is available 48-96 hours after online publication and is updated daily on week days.
Initial download of the metrics may take a while.