Fig. 2
Download original image
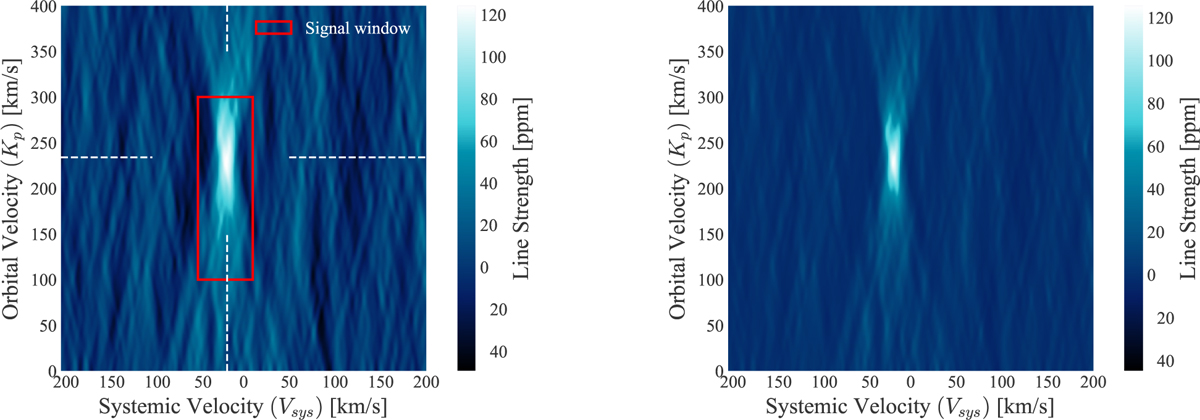
Comparison plot demonstrating the improved signal from applying the combination method for the species Fe I. Left panel: Kp – Vsys map of a single transit observation, this specifically is the first HARPS-N transit. The red border marks the window where the average signal strength is computed, and the region outside where the standard deviation is computed. Right panel: Kp – Vsys map when combining all four transit observations. The result is a much higher S/N.
Current usage metrics show cumulative count of Article Views (full-text article views including HTML views, PDF and ePub downloads, according to the available data) and Abstracts Views on Vision4Press platform.
Data correspond to usage on the plateform after 2015. The current usage metrics is available 48-96 hours after online publication and is updated daily on week days.
Initial download of the metrics may take a while.