Open Access
Fig. C.6
Download original image
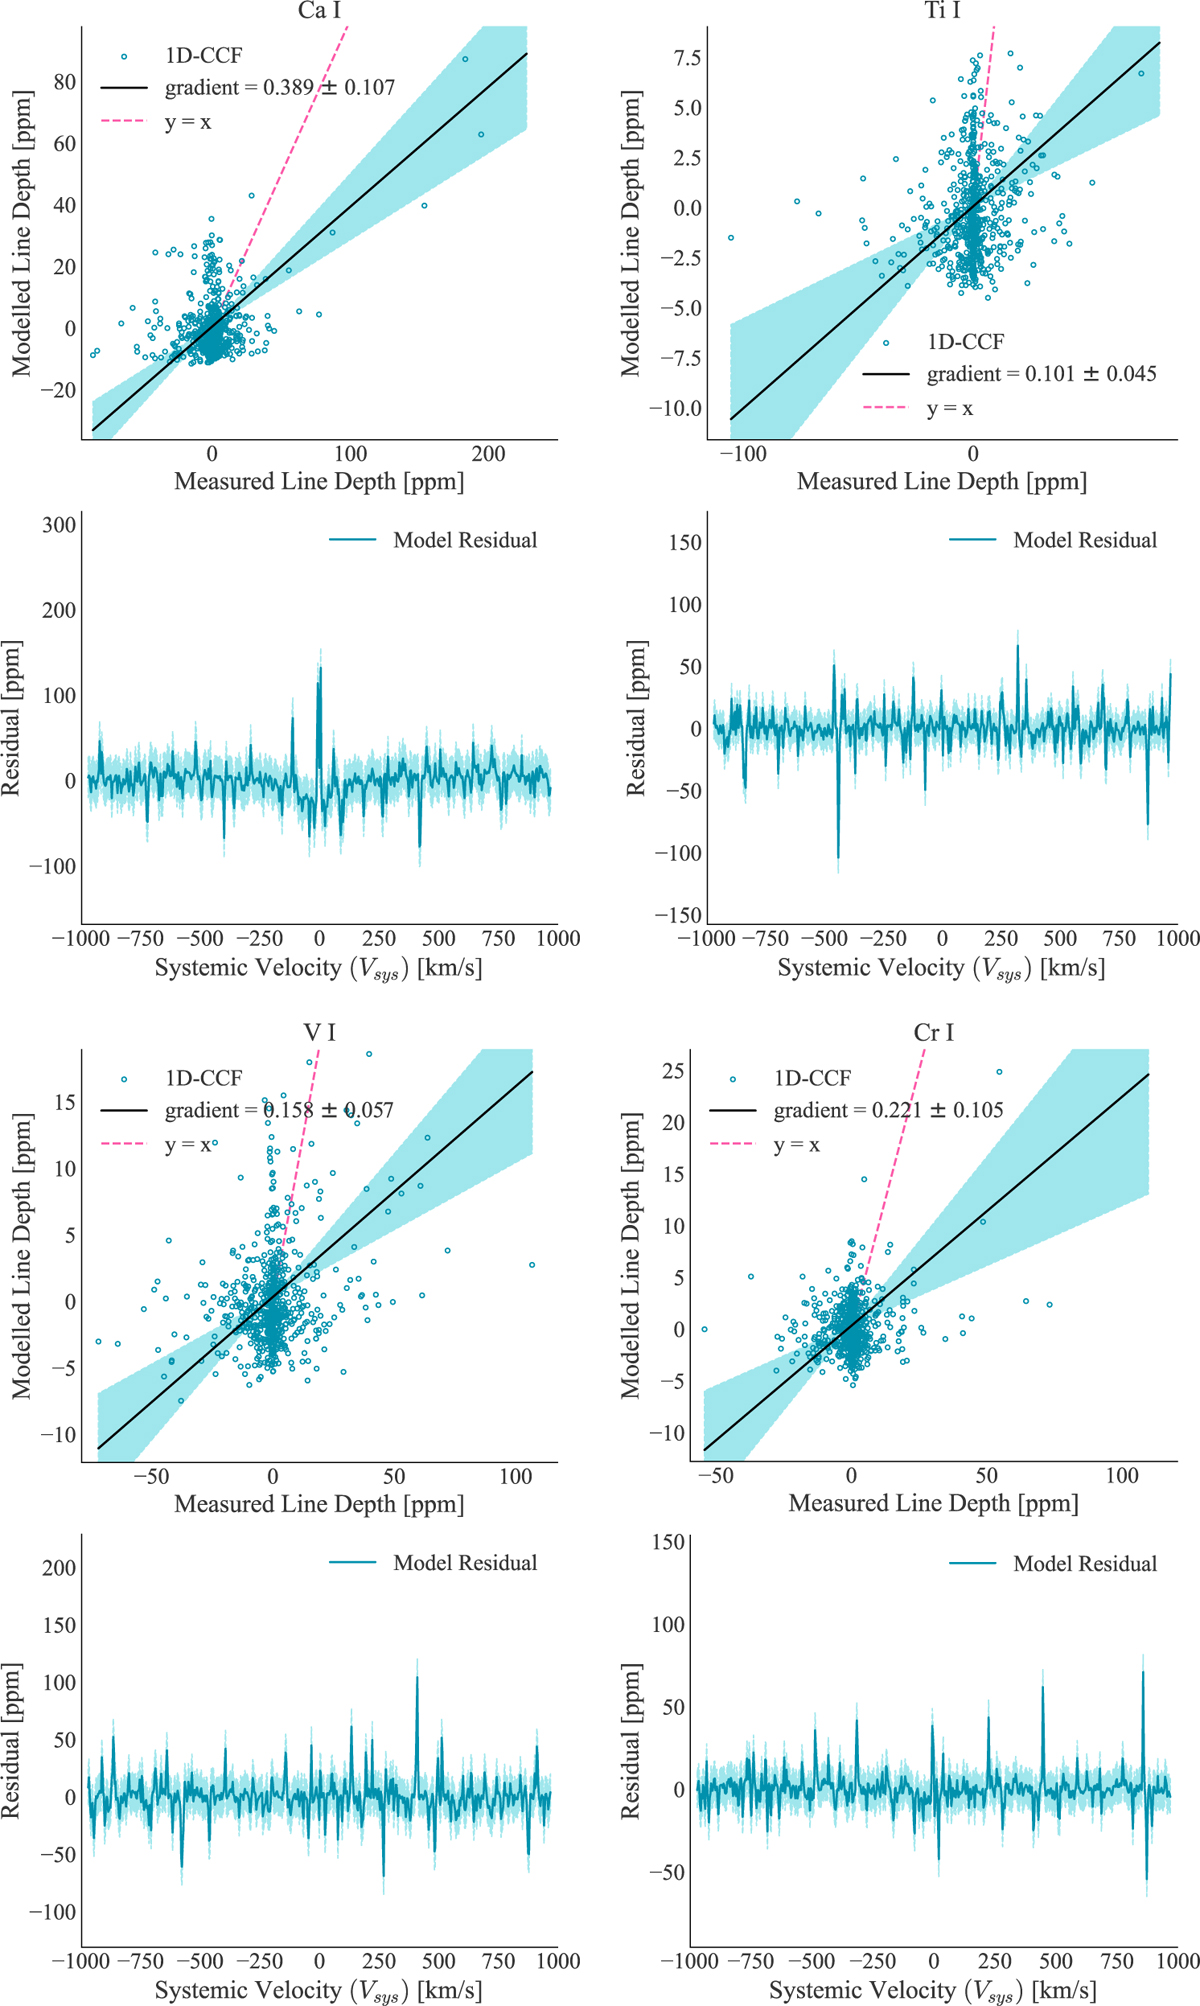
Response and residual plots for each newly detected species in KELT-9 b’s atmosphere. Each panel represents a different species. The order of the species is as follows (left to right): Ca I, Ti I, V I, and Cr I. The format of the plot follows the same structure as Fig. C.3.
Current usage metrics show cumulative count of Article Views (full-text article views including HTML views, PDF and ePub downloads, according to the available data) and Abstracts Views on Vision4Press platform.
Data correspond to usage on the plateform after 2015. The current usage metrics is available 48-96 hours after online publication and is updated daily on week days.
Initial download of the metrics may take a while.