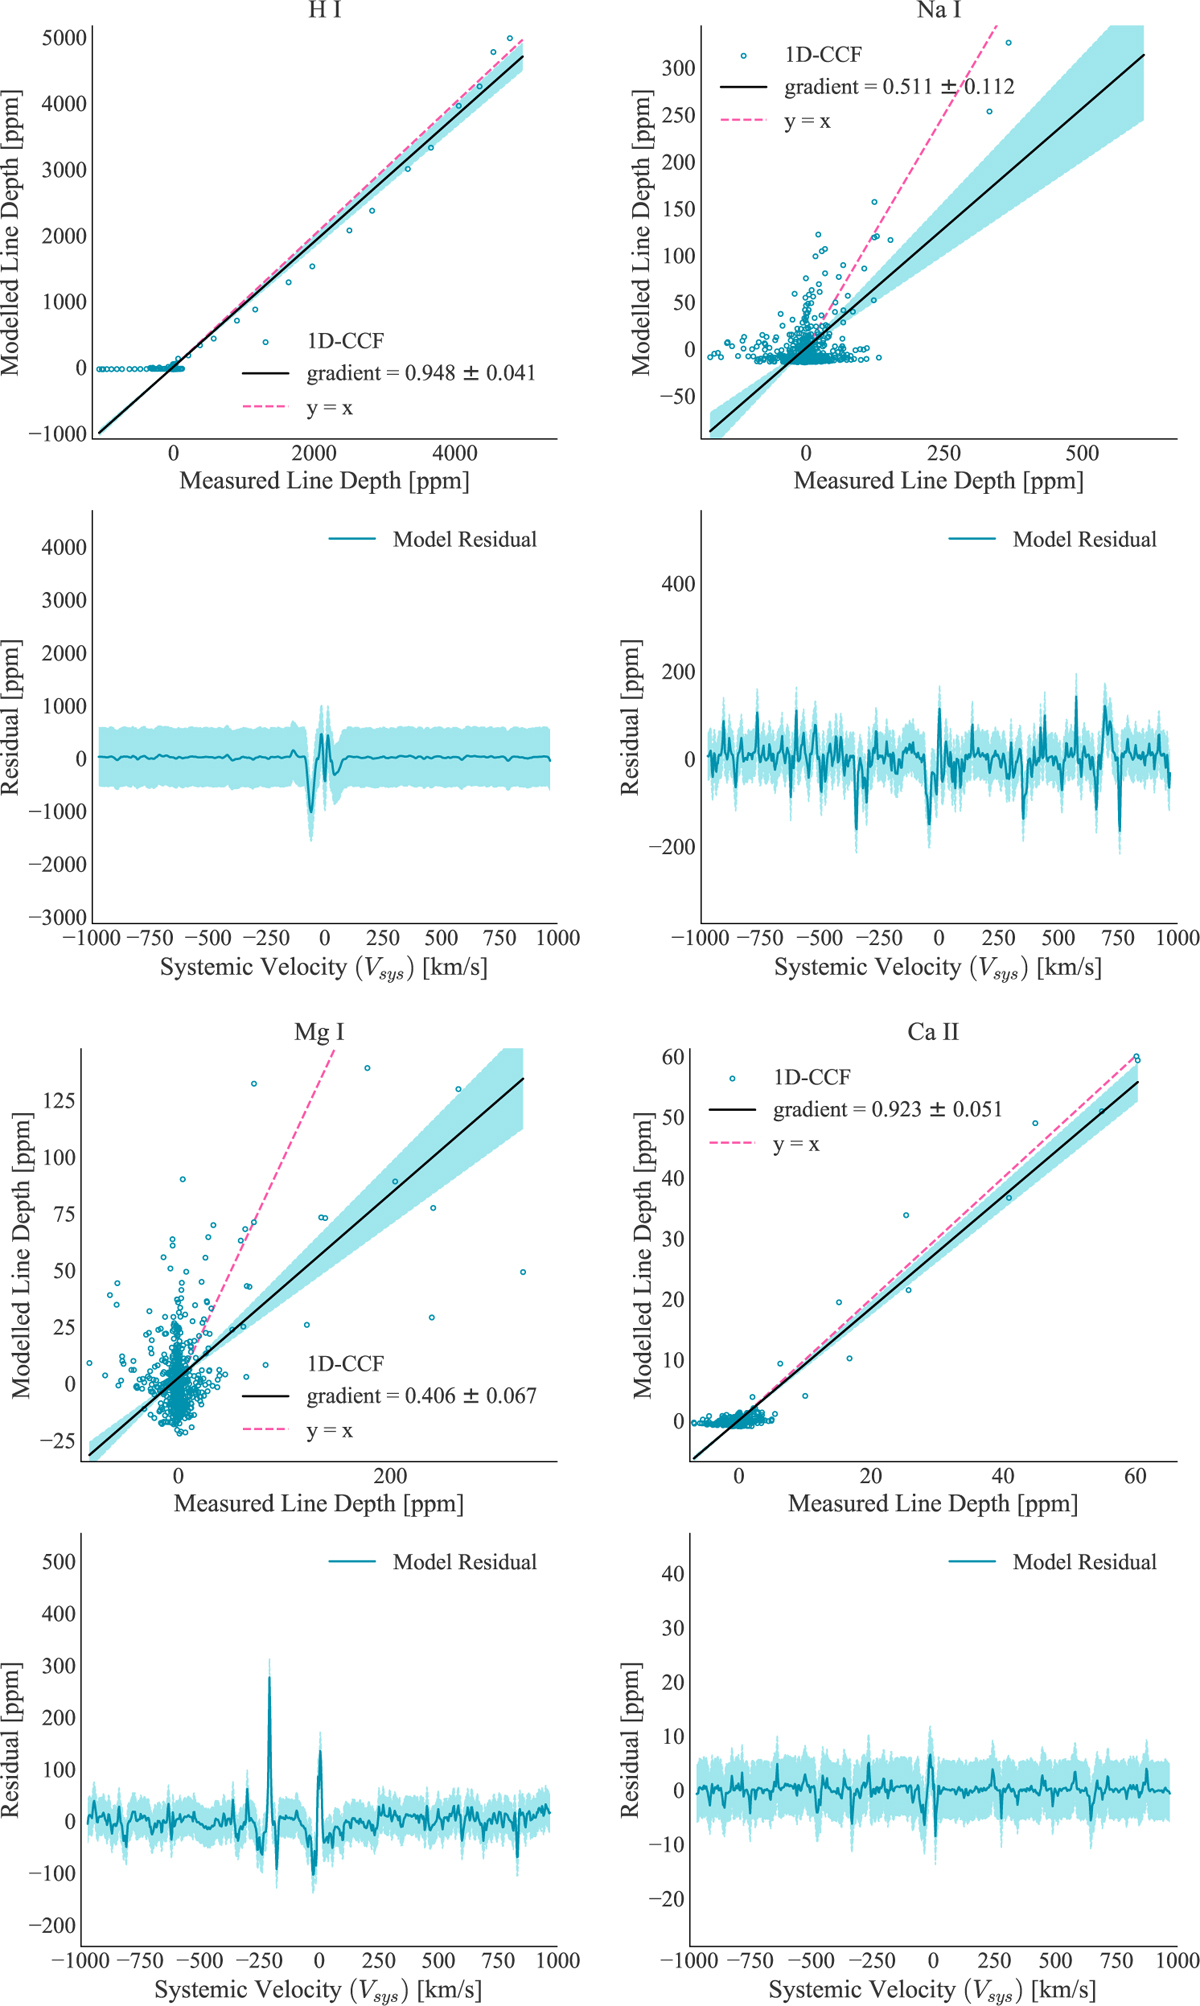
Fig. C.3
Download original image
Response and residual plots for each confirmed species in KELT-9 b’s atmosphere. Each panel represents a different species. The order of the species is as follows (left to right): H I, Na I, Mg I, Ca II, Sc II, Ti II, Cr II, Fe I, Fe II, and Y II. Each plot contains a line of best fit plotted through the data of the response plot, spanned by two lines of worst fit. The identity line y = x is plotted to show how closely the model matches the data. The residual plot contains the residuals and the region spanning one standard deviation of the residual data.
Current usage metrics show cumulative count of Article Views (full-text article views including HTML views, PDF and ePub downloads, according to the available data) and Abstracts Views on Vision4Press platform.
Data correspond to usage on the plateform after 2015. The current usage metrics is available 48-96 hours after online publication and is updated daily on week days.
Initial download of the metrics may take a while.