Fig. C.1
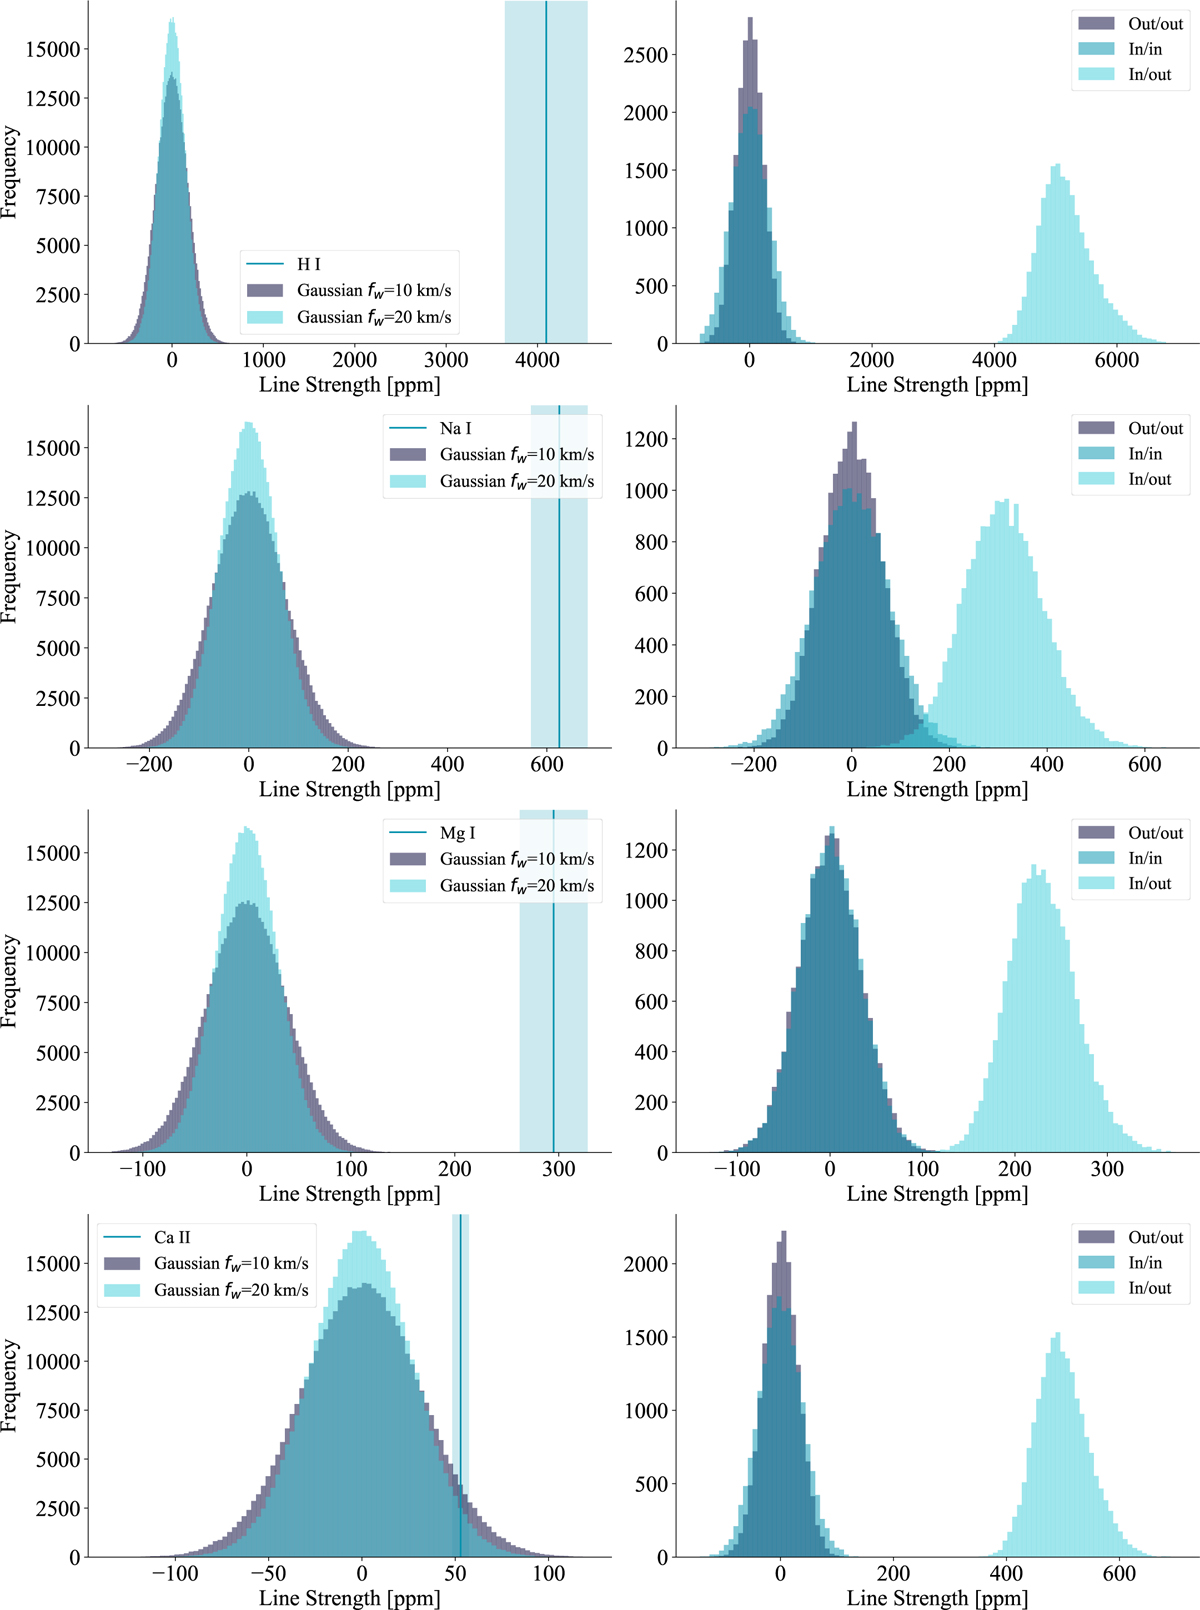
Download original image
Bootstrap results for the confirmed detections. Each panel represents the bootstrap results of each new detection in the respective order of: H I, Na I, Mg I, Ca II, Sc II, Ti II, Cr II, Fe I, Fe II, and Y II. The dark blue histogram represents the random Gaussian sample obtained with the 10 km s−1 width, while the light transparent blue histogram is for the distribution width of 20 km s−1. The solid blue vertical line indicates the measured line depth of the signal, with a standard deviation of the value present as a transparent blue-shaded region. The legend in the right panel plots labels the in-in, in-out and out-out residual distributions calculated during the bootstrapping process.
Current usage metrics show cumulative count of Article Views (full-text article views including HTML views, PDF and ePub downloads, according to the available data) and Abstracts Views on Vision4Press platform.
Data correspond to usage on the plateform after 2015. The current usage metrics is available 48-96 hours after online publication and is updated daily on week days.
Initial download of the metrics may take a while.