Open Access
Fig. 4
Download original image
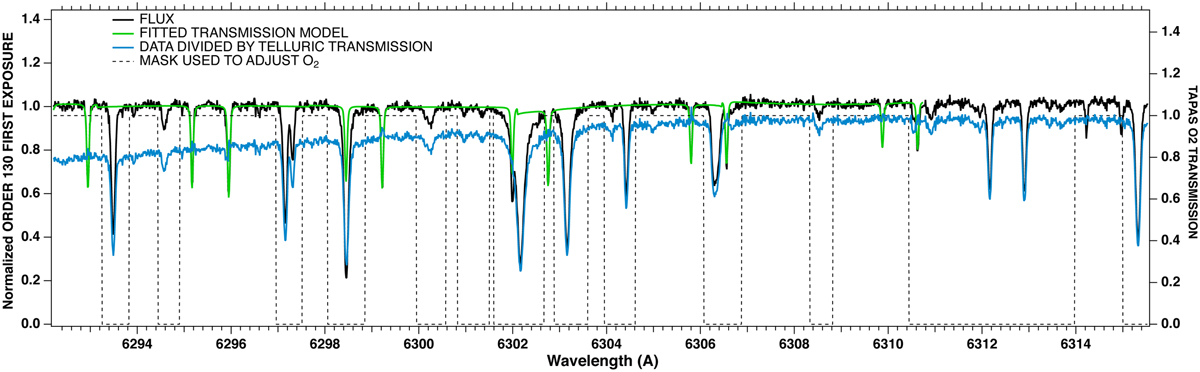
Illustration of the procedure used to determine the O2 column for each exposure (here exposure 0 and order 130). The BMT is shown as a black dashed line. The normalized data and the fitted TAPAS transmission are shown in black and green, respectively. The division of the data by the fit is shown in blue.
Current usage metrics show cumulative count of Article Views (full-text article views including HTML views, PDF and ePub downloads, according to the available data) and Abstracts Views on Vision4Press platform.
Data correspond to usage on the plateform after 2015. The current usage metrics is available 48-96 hours after online publication and is updated daily on week days.
Initial download of the metrics may take a while.