Open Access
Fig. 19
Download original image
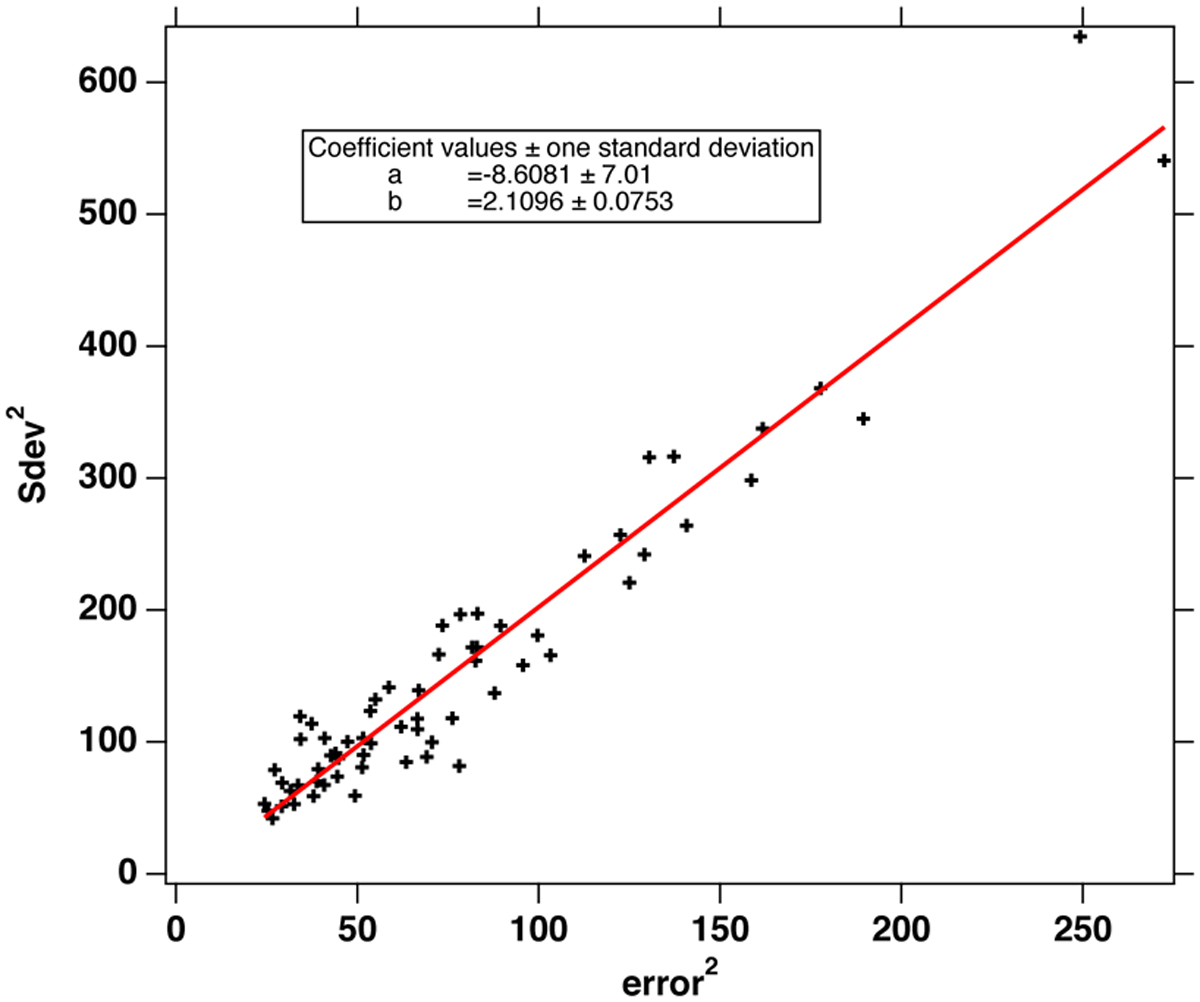
Linear fit of the scatter plot of ![]() as a function of the error2. Each point is for one red order of ESPRESSO. The slope allows us to determine the factor k of underestimation of formal error: k = true error/formal error.
as a function of the error2. Each point is for one red order of ESPRESSO. The slope allows us to determine the factor k of underestimation of formal error: k = true error/formal error.
Current usage metrics show cumulative count of Article Views (full-text article views including HTML views, PDF and ePub downloads, according to the available data) and Abstracts Views on Vision4Press platform.
Data correspond to usage on the plateform after 2015. The current usage metrics is available 48-96 hours after online publication and is updated daily on week days.
Initial download of the metrics may take a while.