Fig. 18
Download original image
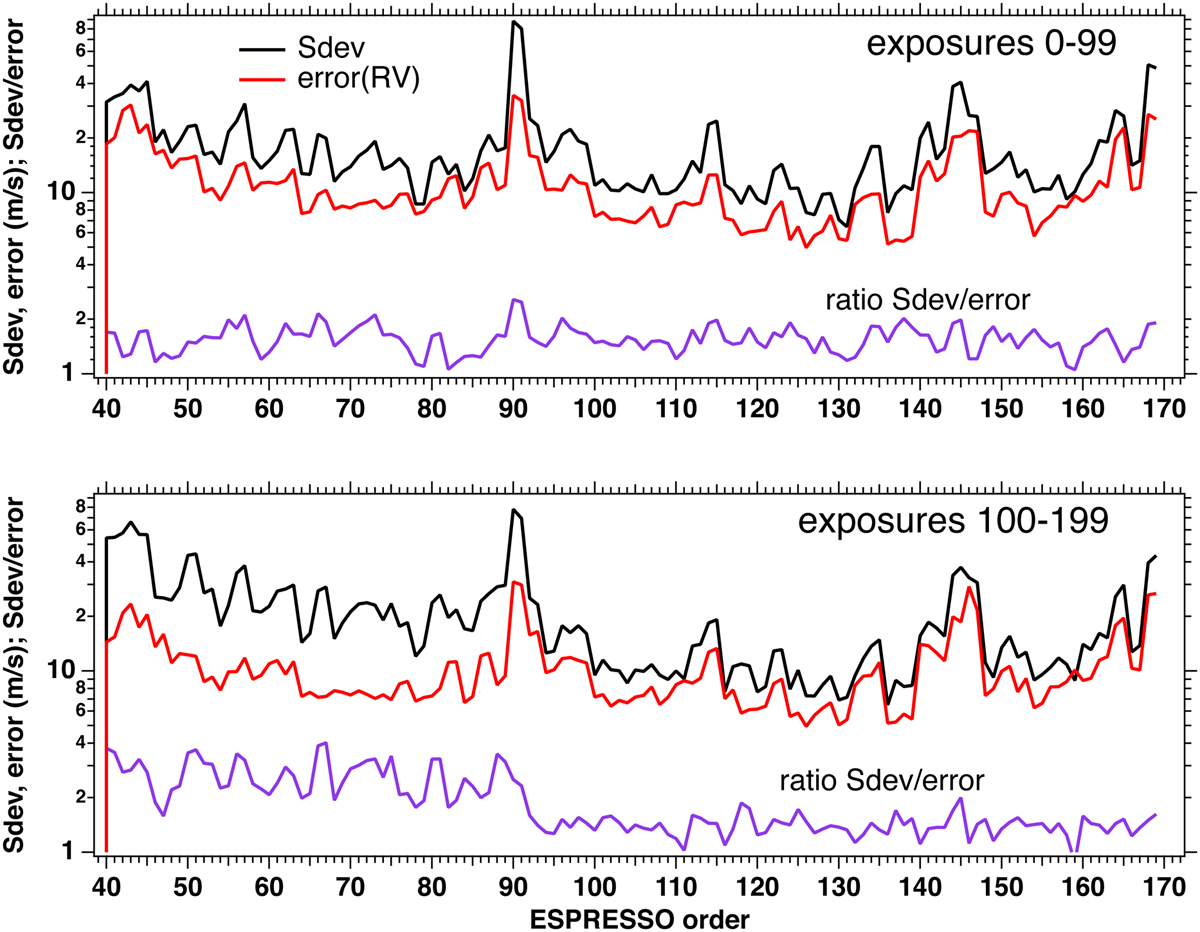
Wavelength and temporal dependence of the observed RV. Top: standard deviation Sdev (black line) and formal error on RV measurements (red line) for each order from our processing, averaged over the first 100 exposures only. The ratio between the two quantities is shown in violet. Bottom: same as top but for the last 100 exposures. We note the high ratio found in the blue orders during the second half of the observational time, a sign of spurious jitter due to a blue cryostat thermal instability.
Current usage metrics show cumulative count of Article Views (full-text article views including HTML views, PDF and ePub downloads, according to the available data) and Abstracts Views on Vision4Press platform.
Data correspond to usage on the plateform after 2015. The current usage metrics is available 48-96 hours after online publication and is updated daily on week days.
Initial download of the metrics may take a while.