Fig. 10
Download original image
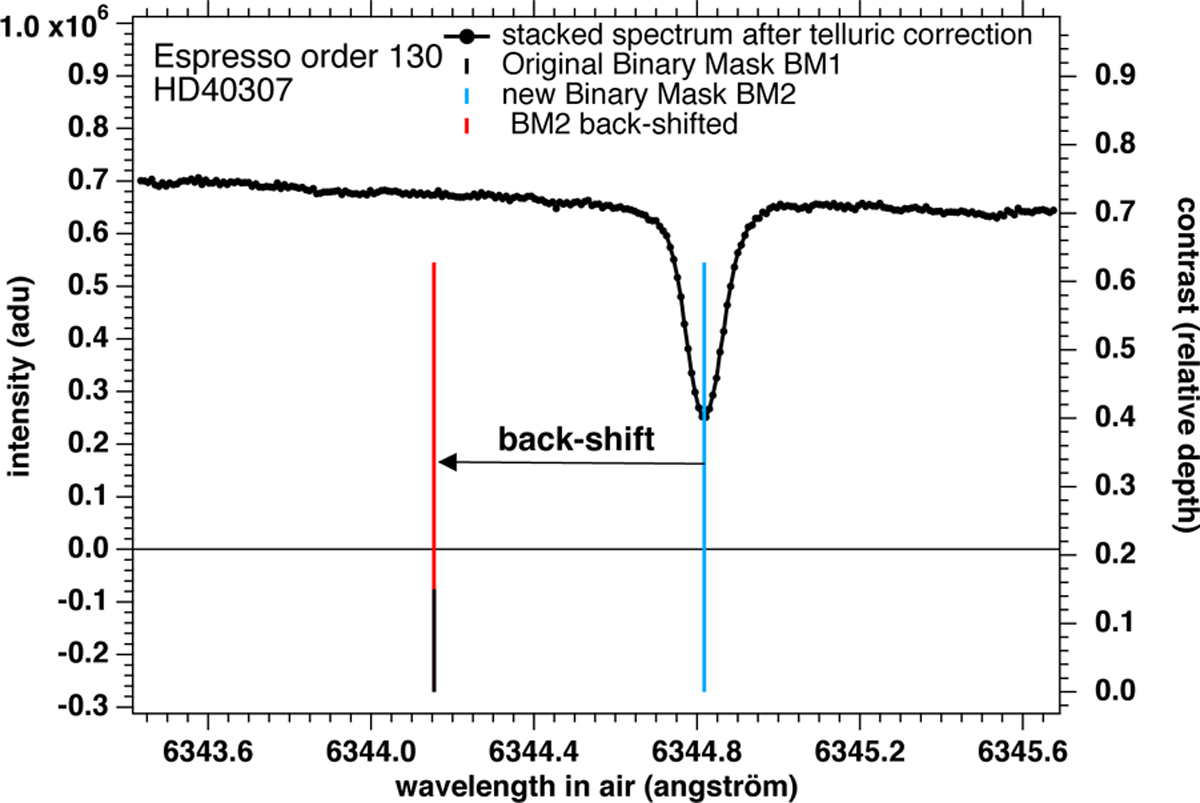
Adjustment of the two masks. The vertical blue line gives the wavelength position of the center of one stellar line of the observed spectrum, after telluric correction and stacking of all exposures. Its height is the contrast of the line (relative depth, 0.64). The red line represent the same line, back-shifted to account for the radial velocity Vrad0 of the star. The velocity Vrad0 was determined with the original mask BM1 and data from orders 92–115. As a result, the position of the red line coincides well (but not perfectly) with the corresponding line of the original BM1 mask (vertical bar, bottom).
Current usage metrics show cumulative count of Article Views (full-text article views including HTML views, PDF and ePub downloads, according to the available data) and Abstracts Views on Vision4Press platform.
Data correspond to usage on the plateform after 2015. The current usage metrics is available 48-96 hours after online publication and is updated daily on week days.
Initial download of the metrics may take a while.