Fig. 4.
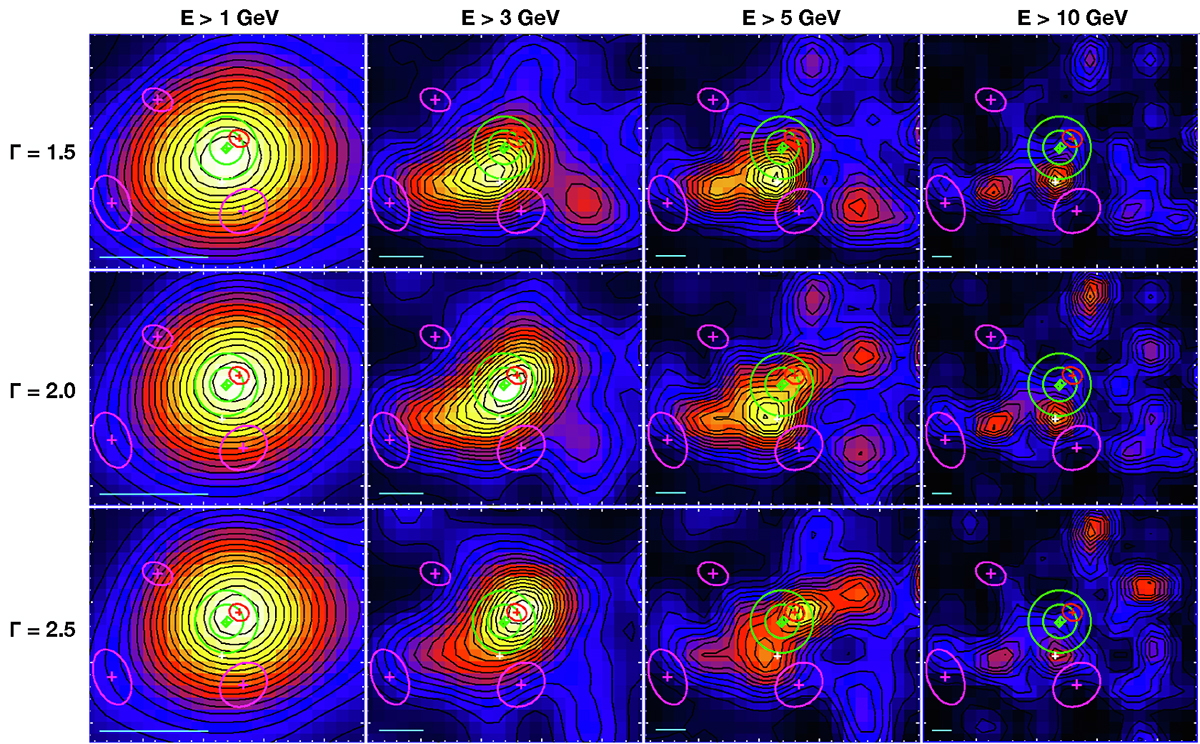
Download original image
Fermi-LAT TS maps computed assuming various photon indexes for the putative source, and above different threshold energies. Each TS map is smoothed with a Gaussian whose sigma is equal to 68% of the Fermi-LAT PSF containment radius measured at each corresponding threshold energy. This size is reported with a cyan segment in the bottom left corner of each plot. Black contours are overplotted with a linear scale to better localize the position of the TS peaks. Green, red, magenta, and white elements are the same as those used and described in Fig. 3. The small white ticks on both axes are in units of 0.1°. Each subplot has been renormalized to its own maximum value to make its color-scale and isocontours comparable.
Current usage metrics show cumulative count of Article Views (full-text article views including HTML views, PDF and ePub downloads, according to the available data) and Abstracts Views on Vision4Press platform.
Data correspond to usage on the plateform after 2015. The current usage metrics is available 48-96 hours after online publication and is updated daily on week days.
Initial download of the metrics may take a while.