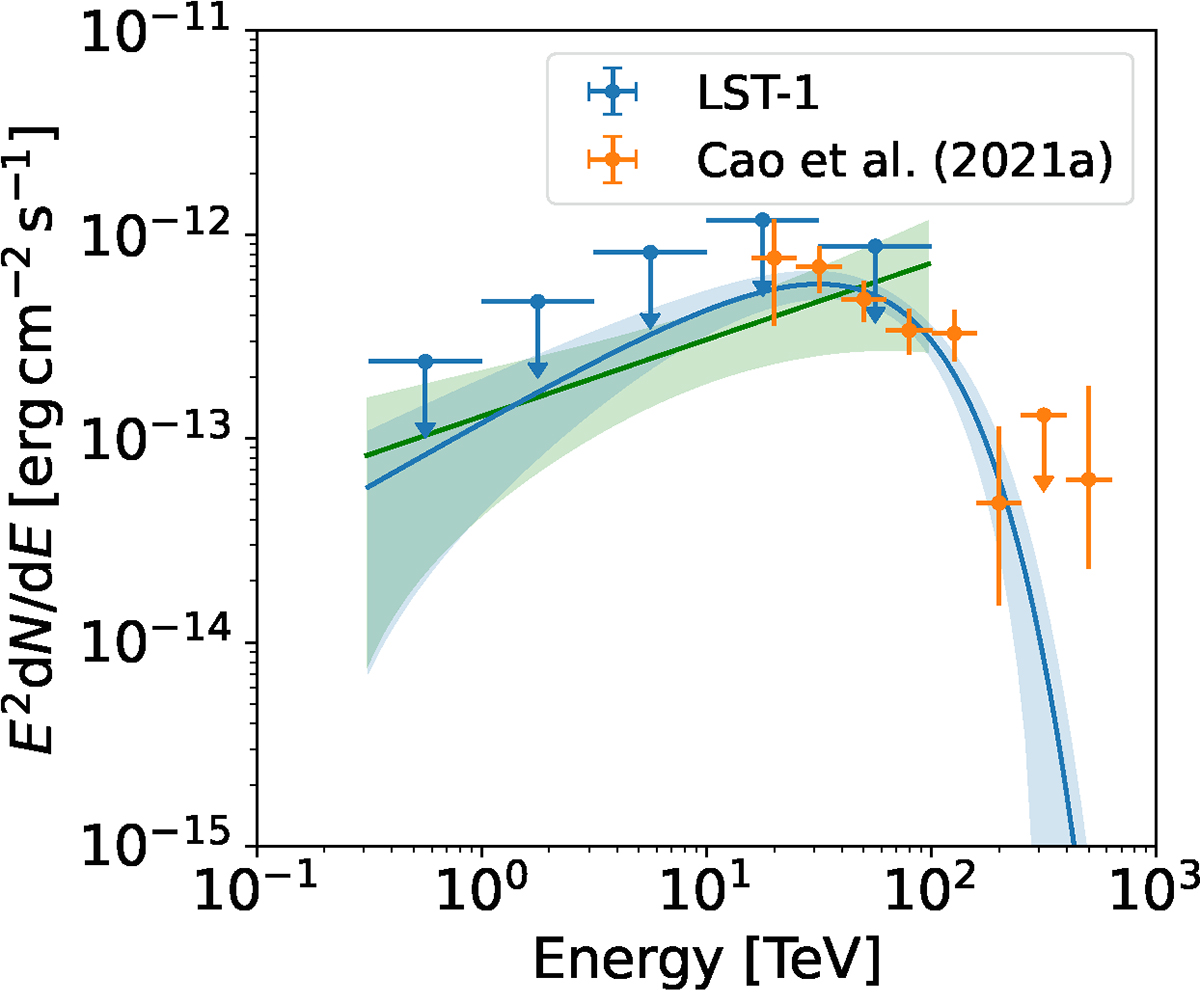
Fig. 2.
Download original image
Spectral energy distribution of the LHAASO J2108+5157 source observed with LST-1. The green confidence band represents the best-fitting PL spectral model of LST-1 data and its statistical uncertainties. The blue confidence band shows a joint likelihood fit of the LST-1 data and LHAASO flux points with an ECPL spectral model. The ECPL spectral model was used to estimate the 95% confidence level ULs on the differential fluxes shown in all energy bins.
Current usage metrics show cumulative count of Article Views (full-text article views including HTML views, PDF and ePub downloads, according to the available data) and Abstracts Views on Vision4Press platform.
Data correspond to usage on the plateform after 2015. The current usage metrics is available 48-96 hours after online publication and is updated daily on week days.
Initial download of the metrics may take a while.