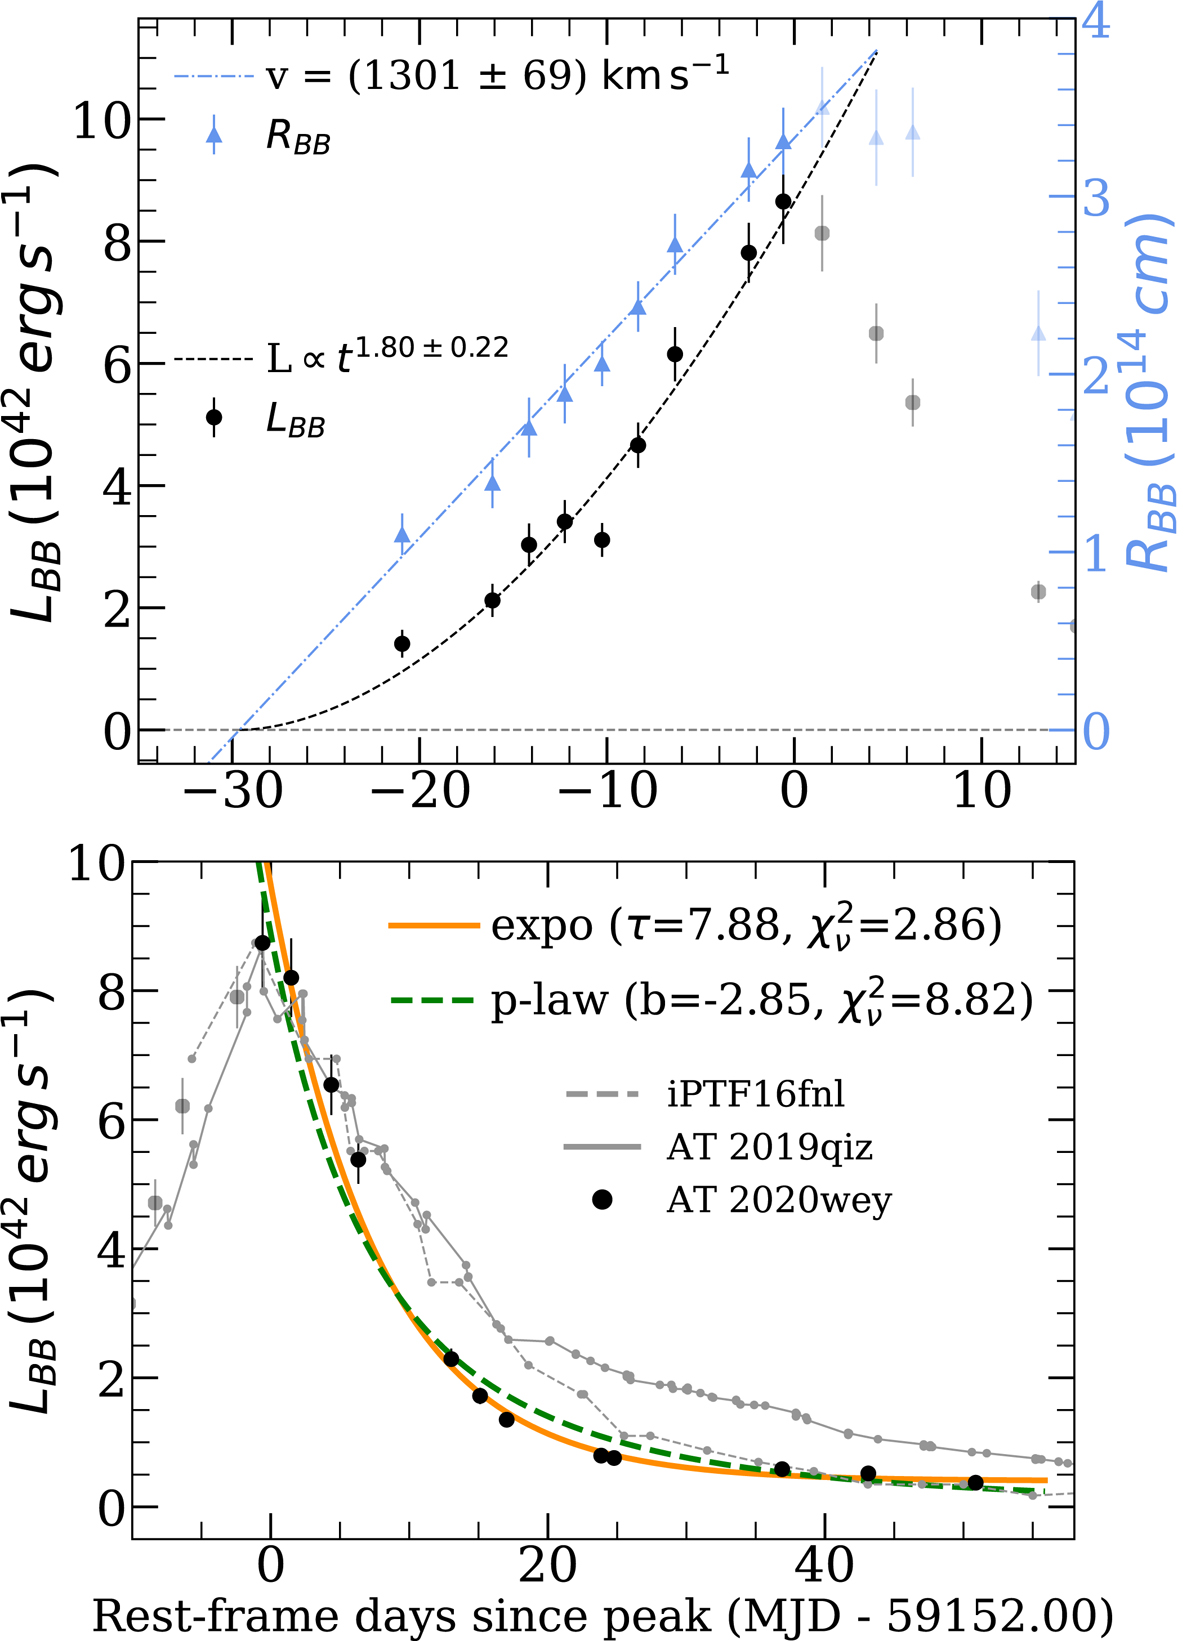
Fig. 5.
Download original image
Fits to the bolometric light curve during rise (top) and decline (bottom) of the light curve. Top: the photospheric radius (blue triangles) before peak grows linearly with a velocity v ≈ 1300 km s−1, while the luminosity (black circles) is best fit as L ∝ t1.8. Bottom: exponential and power-law fits to the declining bolometric light curve. The decline is much steeper than the canonical t−5/3. For comparison, iPTF16fnl and AT 2019qiz are overplotted and their bolometric light curves normalized in order for the three events to have the same peak; AT 2020wey is the fastest declining TDE to date.
Current usage metrics show cumulative count of Article Views (full-text article views including HTML views, PDF and ePub downloads, according to the available data) and Abstracts Views on Vision4Press platform.
Data correspond to usage on the plateform after 2015. The current usage metrics is available 48-96 hours after online publication and is updated daily on week days.
Initial download of the metrics may take a while.