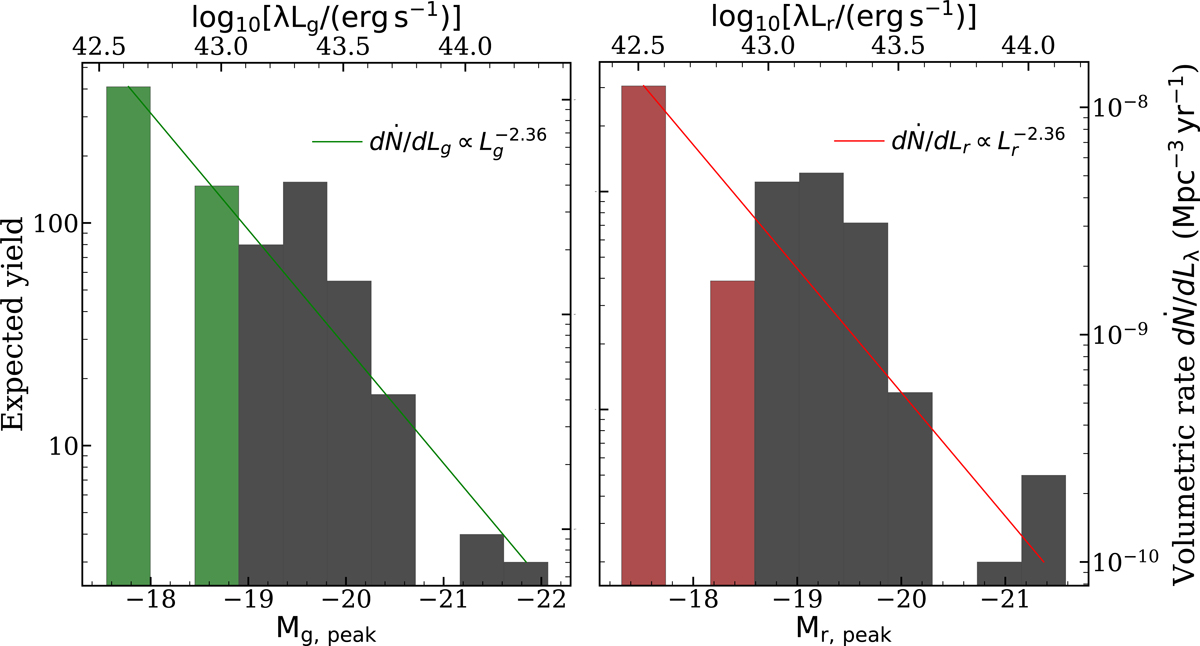
Fig. 14.
Download original image
Fits to the volumetric rates based on the Hammerstein et al. (2023) sample, for the ZTF g band (left) and ZTF r band (right). The histograms denote the expected yields (number of TDEs) after the volumetric correction, and they are the same as the bottom panel of Fig. 13. The colored bins include TDEs that are fainter than or equally faint to AT 2019qiz.
Current usage metrics show cumulative count of Article Views (full-text article views including HTML views, PDF and ePub downloads, according to the available data) and Abstracts Views on Vision4Press platform.
Data correspond to usage on the plateform after 2015. The current usage metrics is available 48-96 hours after online publication and is updated daily on week days.
Initial download of the metrics may take a while.