Fig. 13.
Download original image
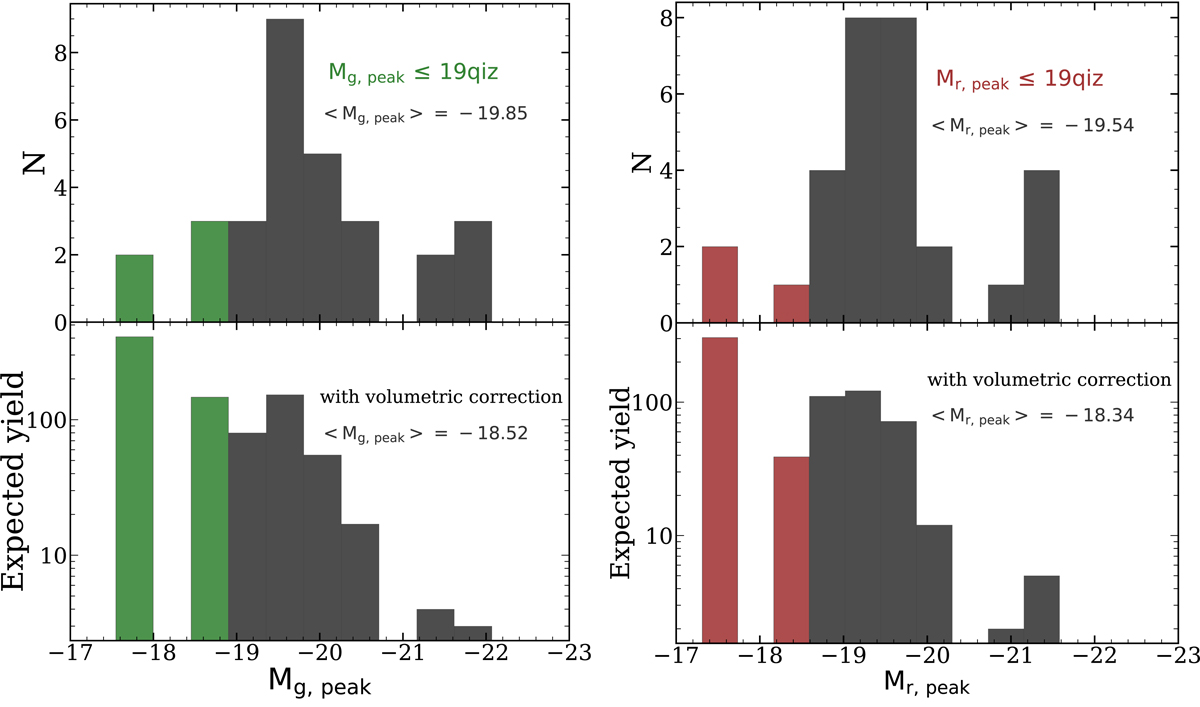
Absolute peak magnitude distributions (k-corrected) of the Hammerstein et al. (2023) TDE sample, with g band on the left and r band on the right. Shown in the top panel are the histograms of the original data (observed distributions) and in the bottom panel the data after volumetric correction (i.e., expected yields, number of TDEs). The colored bins contain TDEs that are fainter than or equally faint to AT 2019qiz.
Current usage metrics show cumulative count of Article Views (full-text article views including HTML views, PDF and ePub downloads, according to the available data) and Abstracts Views on Vision4Press platform.
Data correspond to usage on the plateform after 2015. The current usage metrics is available 48-96 hours after online publication and is updated daily on week days.
Initial download of the metrics may take a while.