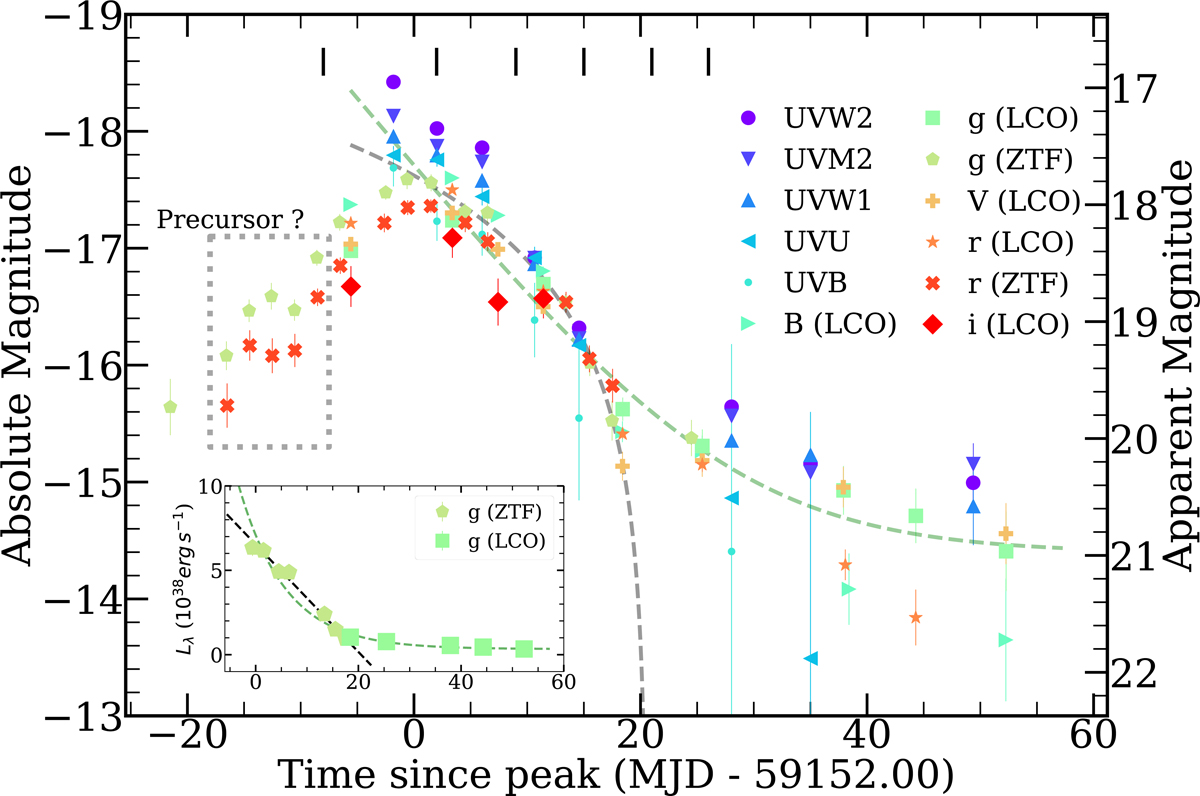
Fig. 1.
Download original image
De-reddened and host-subtracted light curves of AT 2020wey. After the peak, it seems that the light curve goes under two distinct phases: one until ∼20 days and another after 20 days. The inset shows fits in the g band (dashed lines), to the first phase (from peak to ∼20 days), and to the entire evolution. The first phase is fit with a linear fit (black line) and the full decline is fit with an exponential (green line). The same fits are plotted in the main plot (dashed lines) but in magnitude space. The exponential fit describes the late-time data nicely, but fails in following the early phase decline. As the event rises to peak, there seems to be a pre-peak precursor (ZTF g and r bands), never observed before in a TDE, between ∼ − 18 days and −10 days before the peak.
Current usage metrics show cumulative count of Article Views (full-text article views including HTML views, PDF and ePub downloads, according to the available data) and Abstracts Views on Vision4Press platform.
Data correspond to usage on the plateform after 2015. The current usage metrics is available 48-96 hours after online publication and is updated daily on week days.
Initial download of the metrics may take a while.