Fig. 8
Download original image
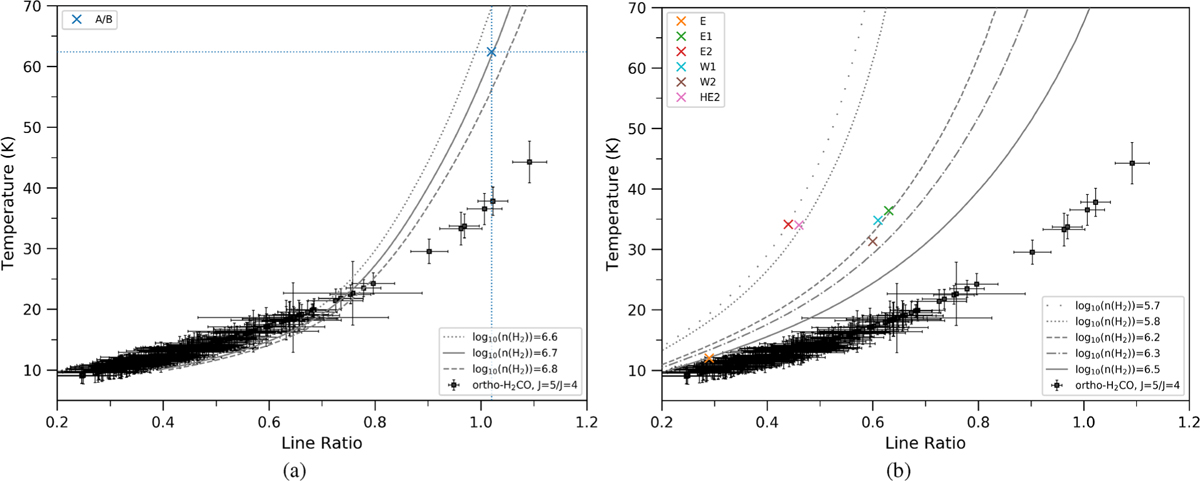
Temperature (in Kelvin) as function of the H2CO (51,5−41,4)/(41,4−31,3) line ratio. The black datapoints illustrate the calculated excitation temperatures from the individual pixels of the corresponding line ratio maps. The gray lines indicate RADEX models of the kinetic temperature as function of line ratio for different values of H2 volume density as indicated in the lower right panel. The models were computed using ortho-H2CO column densities of (a) 2.9 × 1014 cm−2 (b) 3.9 × 1013 cm−2, which correspond to the values at A/B and the average on the other positions, respectively. Color markers indicate the line ratios and temperatures observed at the positions stated in the upper left corners.
Current usage metrics show cumulative count of Article Views (full-text article views including HTML views, PDF and ePub downloads, according to the available data) and Abstracts Views on Vision4Press platform.
Data correspond to usage on the plateform after 2015. The current usage metrics is available 48-96 hours after online publication and is updated daily on week days.
Initial download of the metrics may take a while.