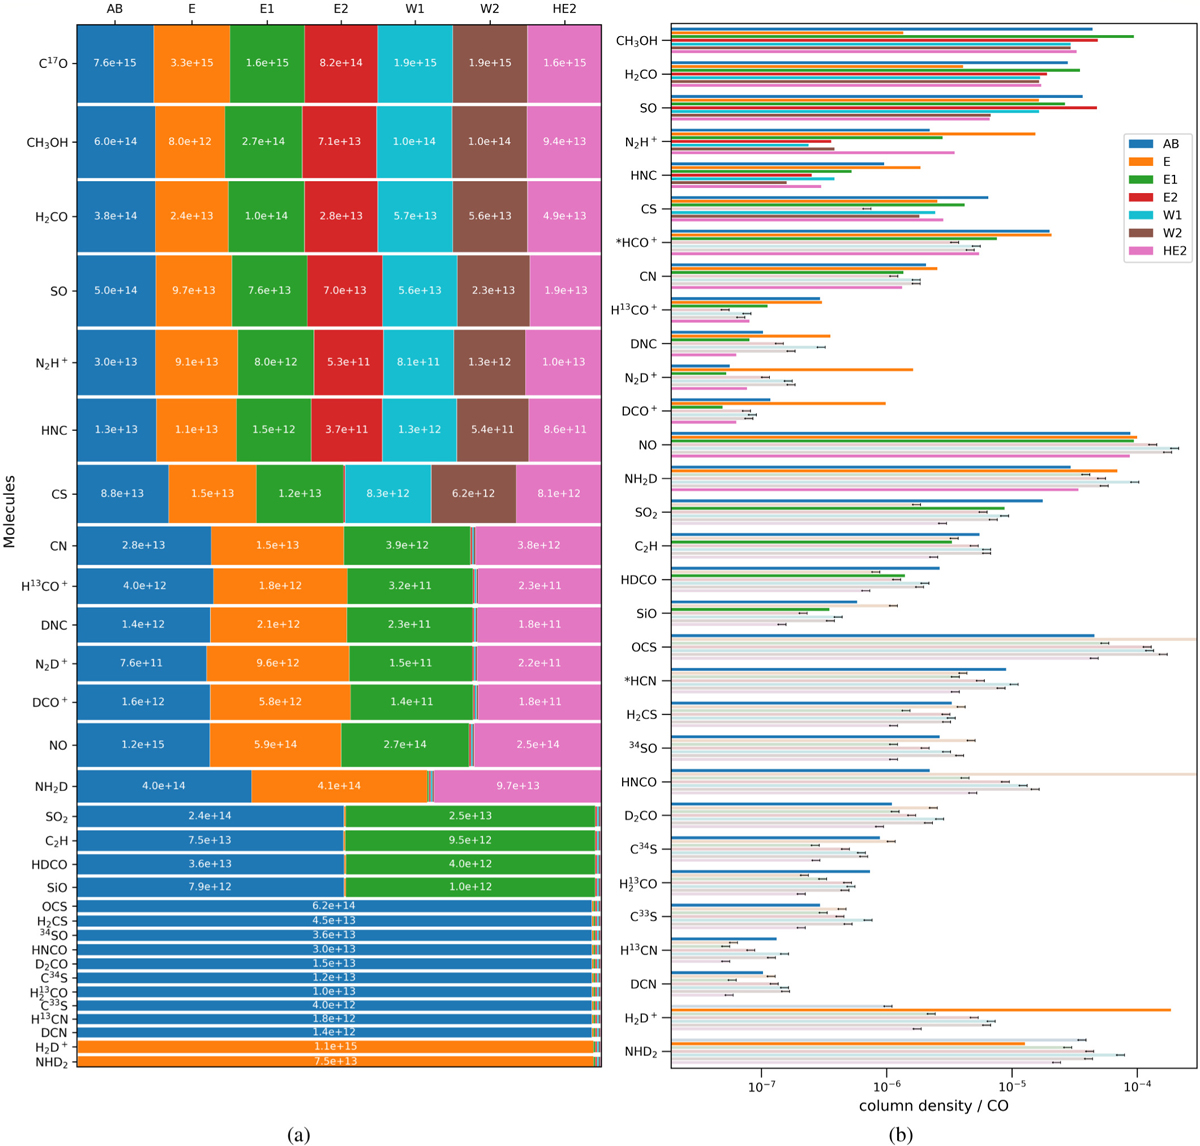
Fig. 7
Download original image
Visualization of the column densities derived with the LTE CLASS-Module weeds. (a) Mosaic plot showing the column densities of species at the individual emission peaks in units of cm−2. Tile areas represent the logarithmic scaled absolute column densities in order to also emphasize the distribution of less abundant species. CO, HCO+, and HCN are not displayed, as their self-absorbed line profiles prevent a direct estimation of corresponding column densities. We note that these species show emission at all peak positions. (b) Bar plot of the column densities in units of the CO column density at the respective positions, as indicated by the colors in the upper right panel. Gray bars with arrows pointing left visualize derived upper limits for the column densities, abundances of HCO+ and HCN are marked with a *, as these are calculated from the less abundant isotopologues H13CO+ and H13CN.
Current usage metrics show cumulative count of Article Views (full-text article views including HTML views, PDF and ePub downloads, according to the available data) and Abstracts Views on Vision4Press platform.
Data correspond to usage on the plateform after 2015. The current usage metrics is available 48-96 hours after online publication and is updated daily on week days.
Initial download of the metrics may take a while.