Fig. 5
Download original image
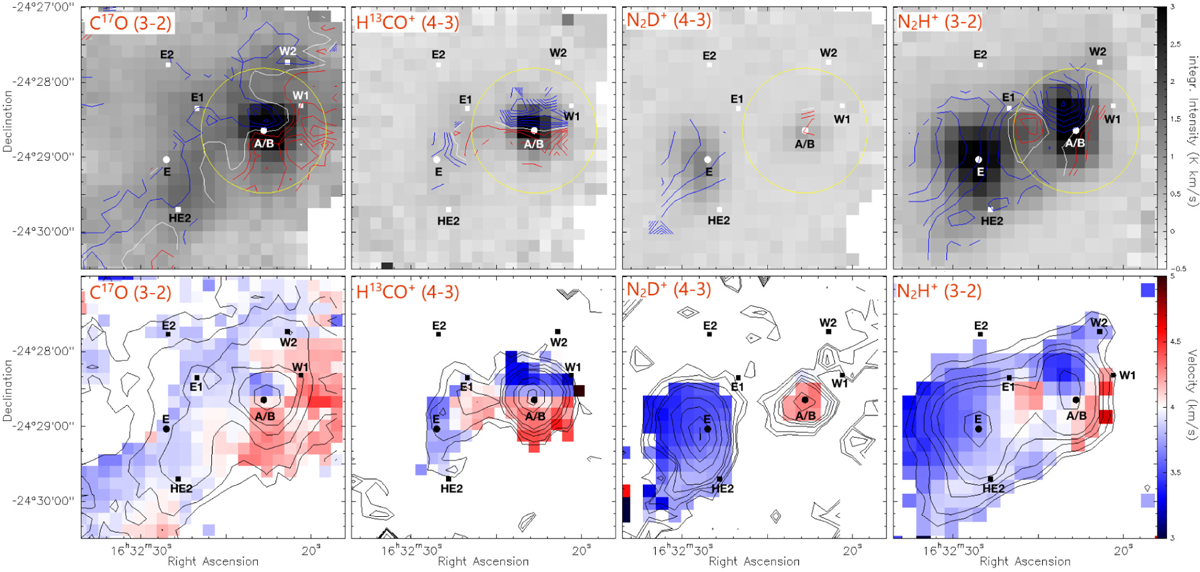
Velocity maps of C17O (3−2), H13CO+ (4−3), N2D+ (4−3), and N2H+ (3−2). Top panels: moment 0 maps of the respective transitions are shown in grayscale. The overlaid contours show the red-shifted and blue-shifted emission in steps of 0.1 km s−1 with respect to the systematic velocity of the source (υLSR = 4 km s−1, displayed in white). Integration ranges consider emission between 2-6 km s−1 for C17O (3−2) and H13CO+ (4−3). Smaller velocity intervals of 2.5 − 5 km s−1 and 2.3-5 km s−1 are chosen for N2D+ (4−3) and N2H+ (3−2) respectively, in order to exclude nearby HDCO emission and the resolved hyperfine components of N2H+. Bottom panels: moment 1 maps of the molecules shown in the top panels. Contours of the moment 0 maps are drawn at 3σ, in steps of 2σ between 4σ and 10σ and in steps of 10σ afterwards. The yellow circle has a radius of 50'' to illustrate the approximate size of the envelope around A/B sources. The plots show the morphology of the velocity field in the environment of IRAS 16293−2422. A large-scale velocity gradient is observed in the NE−SW direction.
Current usage metrics show cumulative count of Article Views (full-text article views including HTML views, PDF and ePub downloads, according to the available data) and Abstracts Views on Vision4Press platform.
Data correspond to usage on the plateform after 2015. The current usage metrics is available 48-96 hours after online publication and is updated daily on week days.
Initial download of the metrics may take a while.