Fig. 3
Download original image
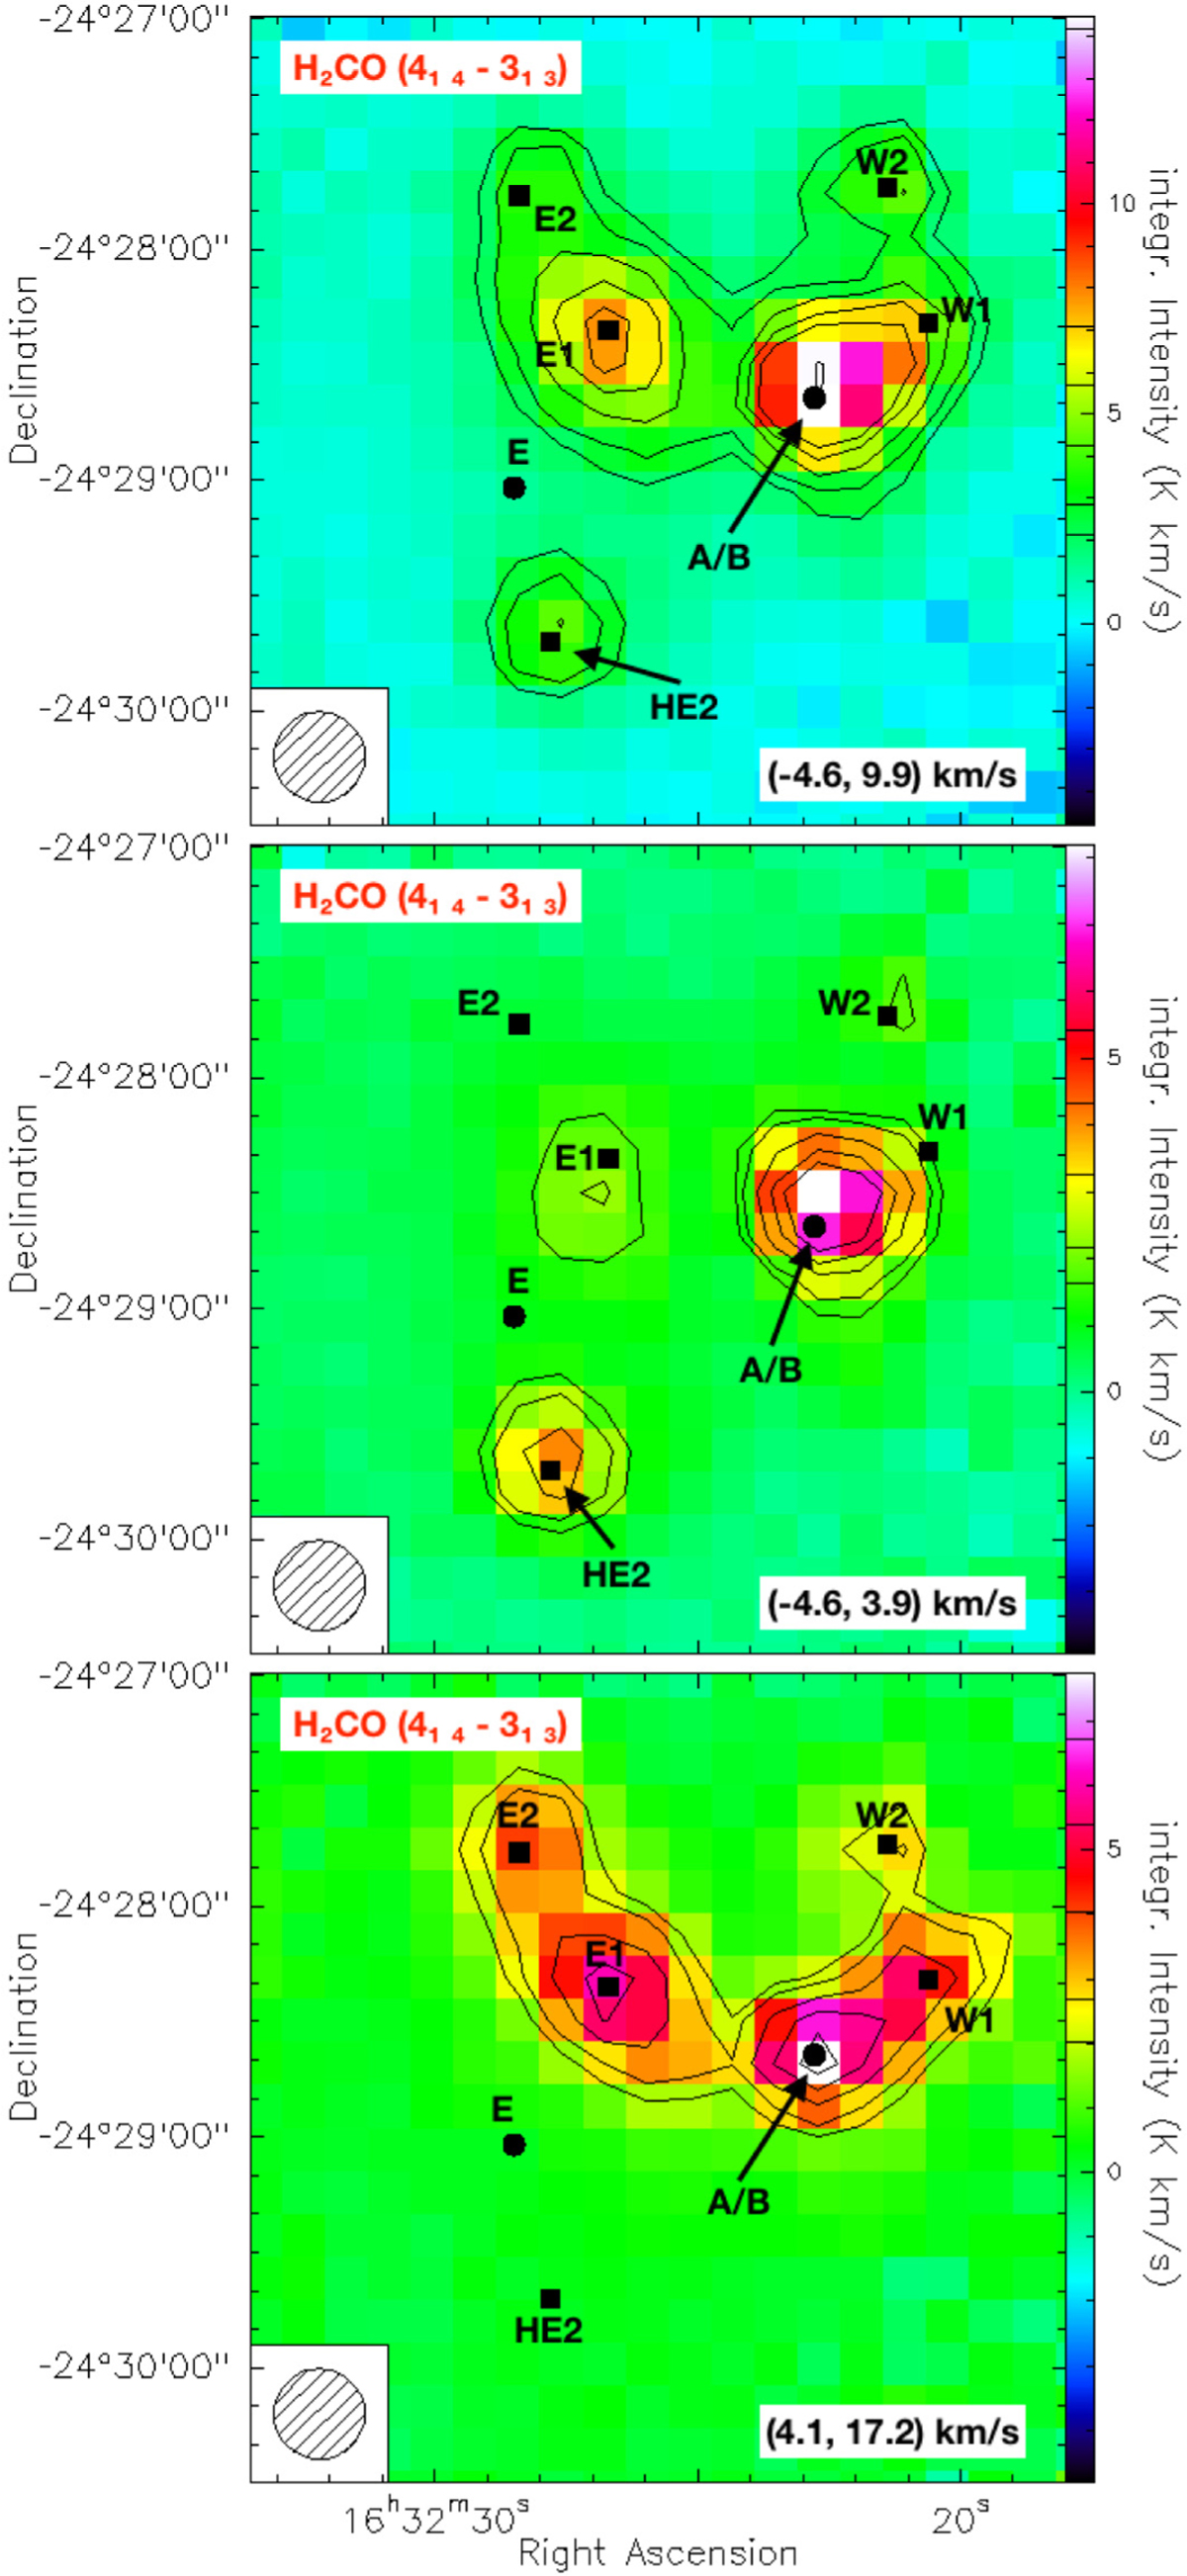
H2CO (41,4−31,3) integrated intensity (moment 0) maps. The integrated velocity ranges are given in the lower right corner of the figures and correspond to the line core (top) and the blue (middle) and redshifted (bottom) emission. The map RMS (σ) are 0.64 K km s−1 (top), 0.49 K km s−1 (middle) and 0.61 K km s−1 (bottom). Contours are drawn at 3σ, in steps of 2σ between 4σ and 10σ and in steps of 10σ afterwards. The right sided color bar indicates the intensity of the emission in units of K km s−1. The black circles mark the positions of IRAS 16293 A/B and E, while the black squares mark positions according to Table B.1. The beam size is included in the lower left corners.
Current usage metrics show cumulative count of Article Views (full-text article views including HTML views, PDF and ePub downloads, according to the available data) and Abstracts Views on Vision4Press platform.
Data correspond to usage on the plateform after 2015. The current usage metrics is available 48-96 hours after online publication and is updated daily on week days.
Initial download of the metrics may take a while.