Fig. E.1
Download original image
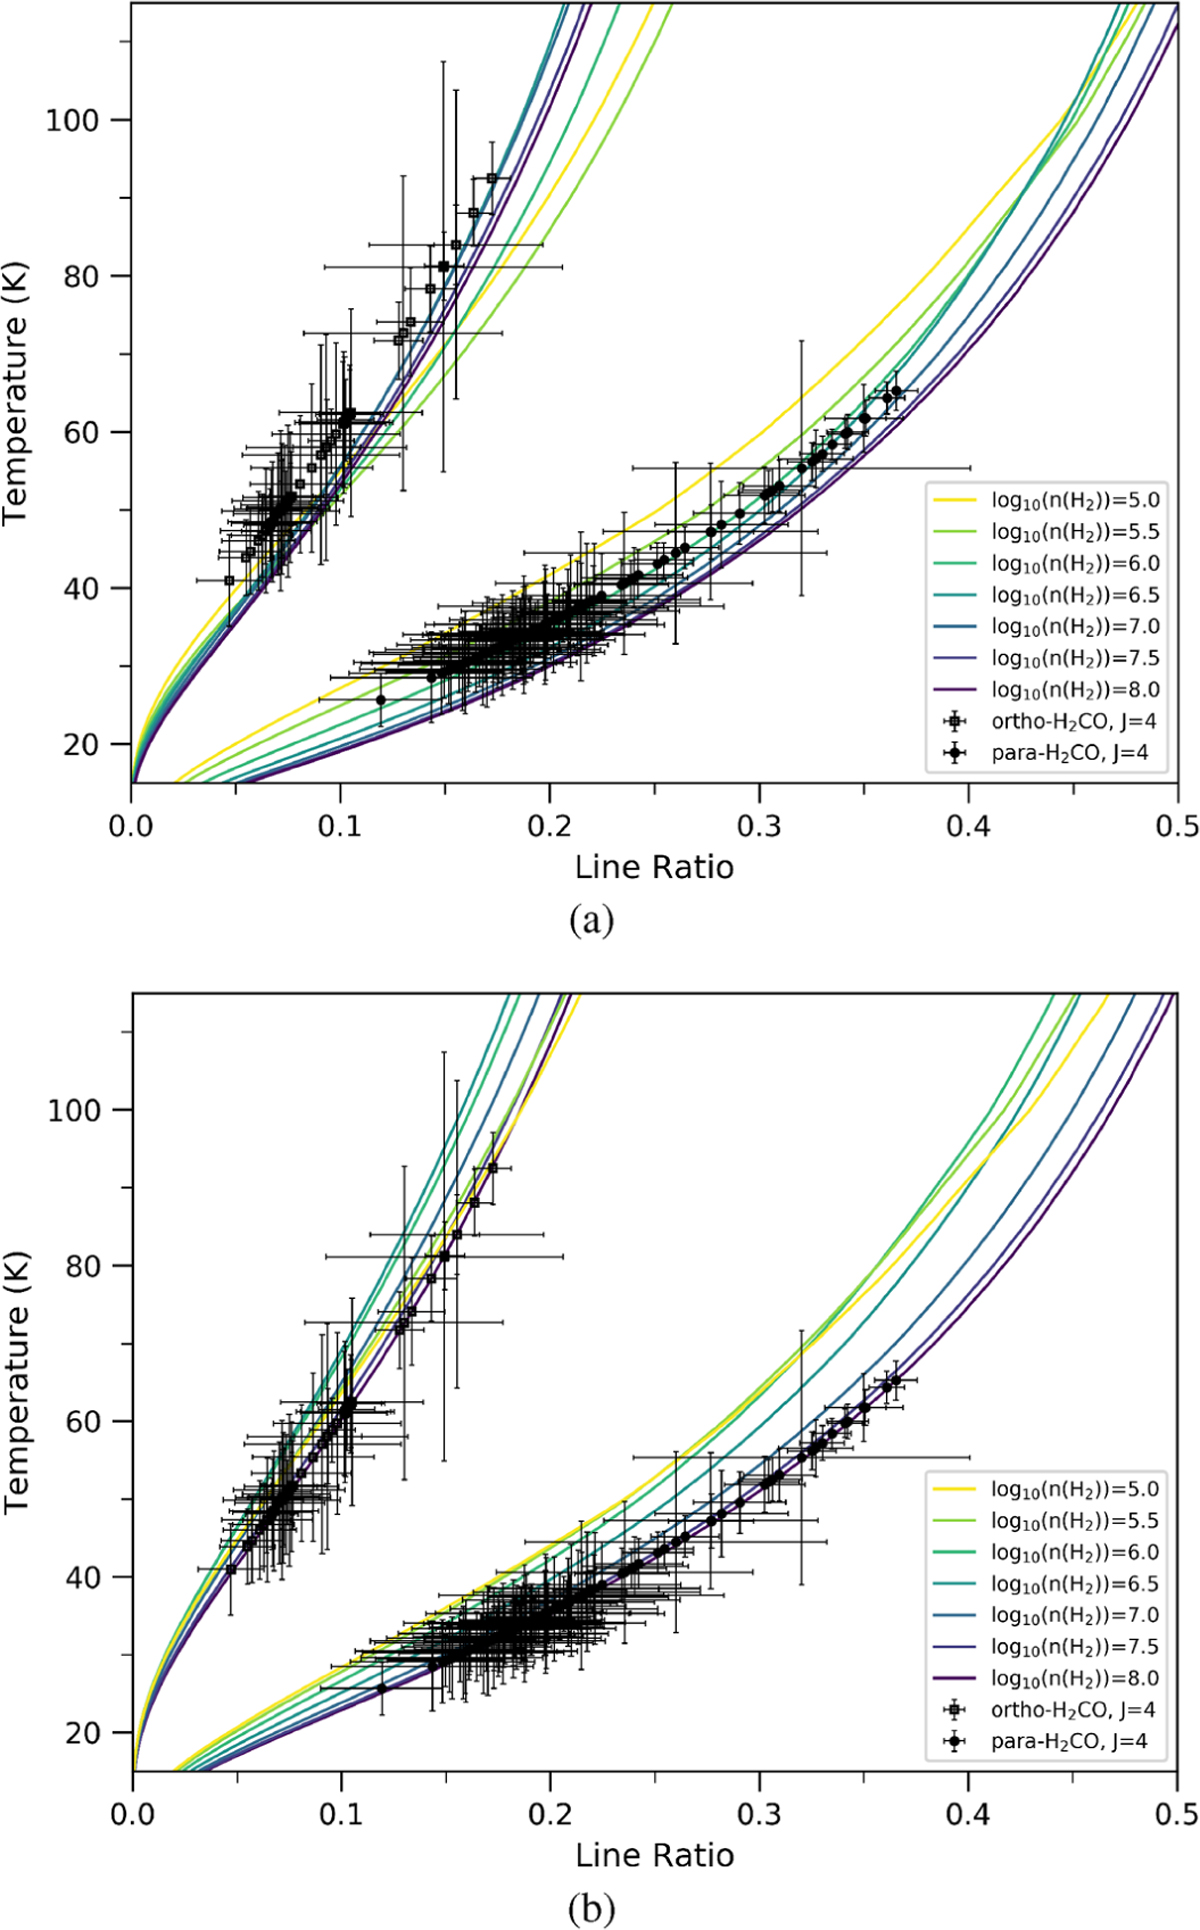
Temperature (in Kelvin) as function of line ratio of the H2CO transitions with Jup = 4. The datapoints show the calculated excitation temperatures from the individual pixels of the maps shown in Fig. 6. Square markers in the upper left side of the figure correspond to the ortho-H2CO transitions, while circle markers in the lower right side correspond to the para-H2CO transitions. The solid color lines indicate the RADEX models of kinetic temperature as function of line ratio for different values of H2 volume density as indicated in the lower right panel. These models were computed using H2CO column densities of (a) 3.8 × 1014cm−2 and (b) 5.2 × 1013cm−2, which correspond to the column densities at A/B and the average on the other positions, respectively.
Current usage metrics show cumulative count of Article Views (full-text article views including HTML views, PDF and ePub downloads, according to the available data) and Abstracts Views on Vision4Press platform.
Data correspond to usage on the plateform after 2015. The current usage metrics is available 48-96 hours after online publication and is updated daily on week days.
Initial download of the metrics may take a while.