Fig. 12
Download original image
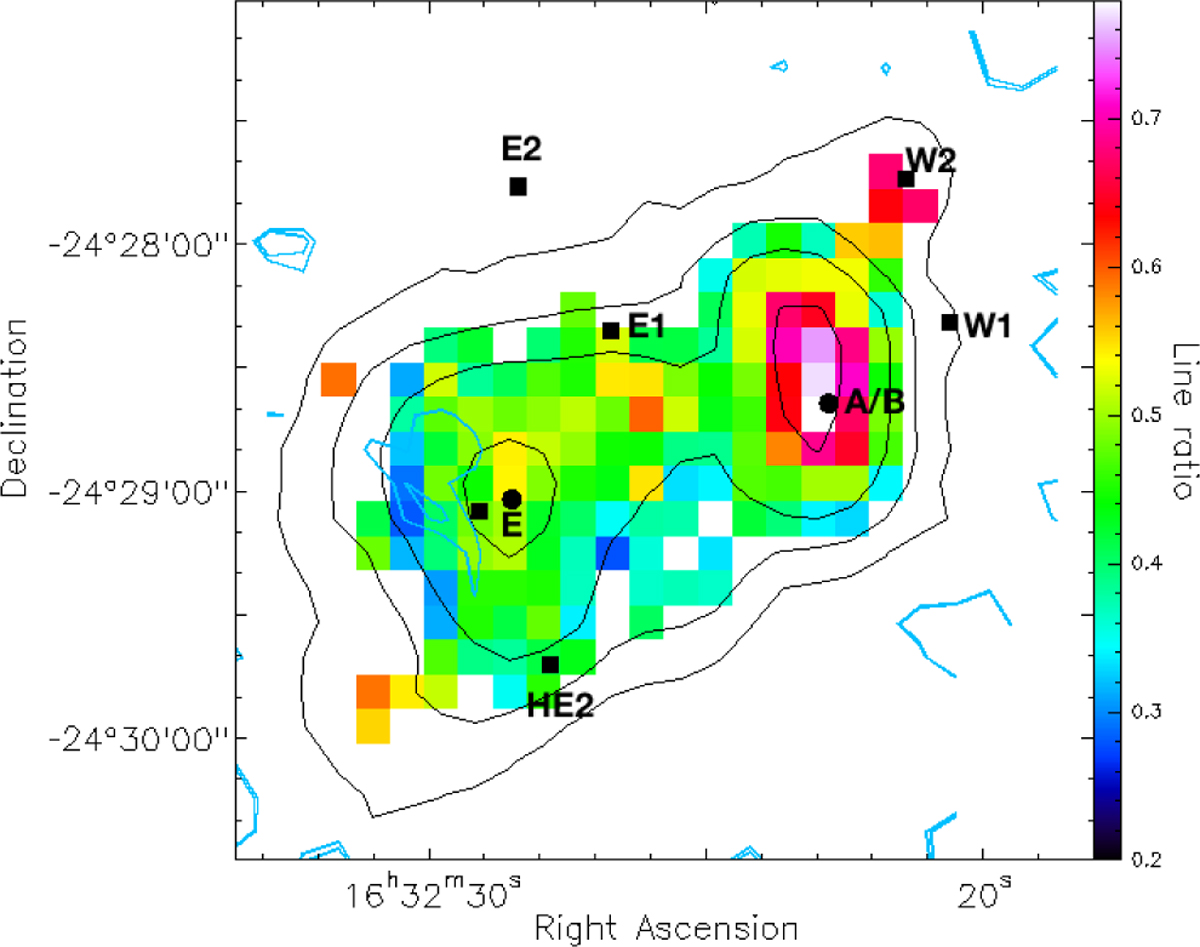
Line ratio between the N2H+ (4−3) and N2H+ (3−2) transitions (color scale). The blue contours show the emission of H2D+ while the black contours indicate the extent of the N2H+ (3−2) emission. The additional square marker east of 16293E marks the 450 μm dust continuum peak. Low line ratio values close to the H2D+ peak agree with the interpretation of having the coldest (and densest) part toward this spot.
Current usage metrics show cumulative count of Article Views (full-text article views including HTML views, PDF and ePub downloads, according to the available data) and Abstracts Views on Vision4Press platform.
Data correspond to usage on the plateform after 2015. The current usage metrics is available 48-96 hours after online publication and is updated daily on week days.
Initial download of the metrics may take a while.