Fig. 10
Download original image
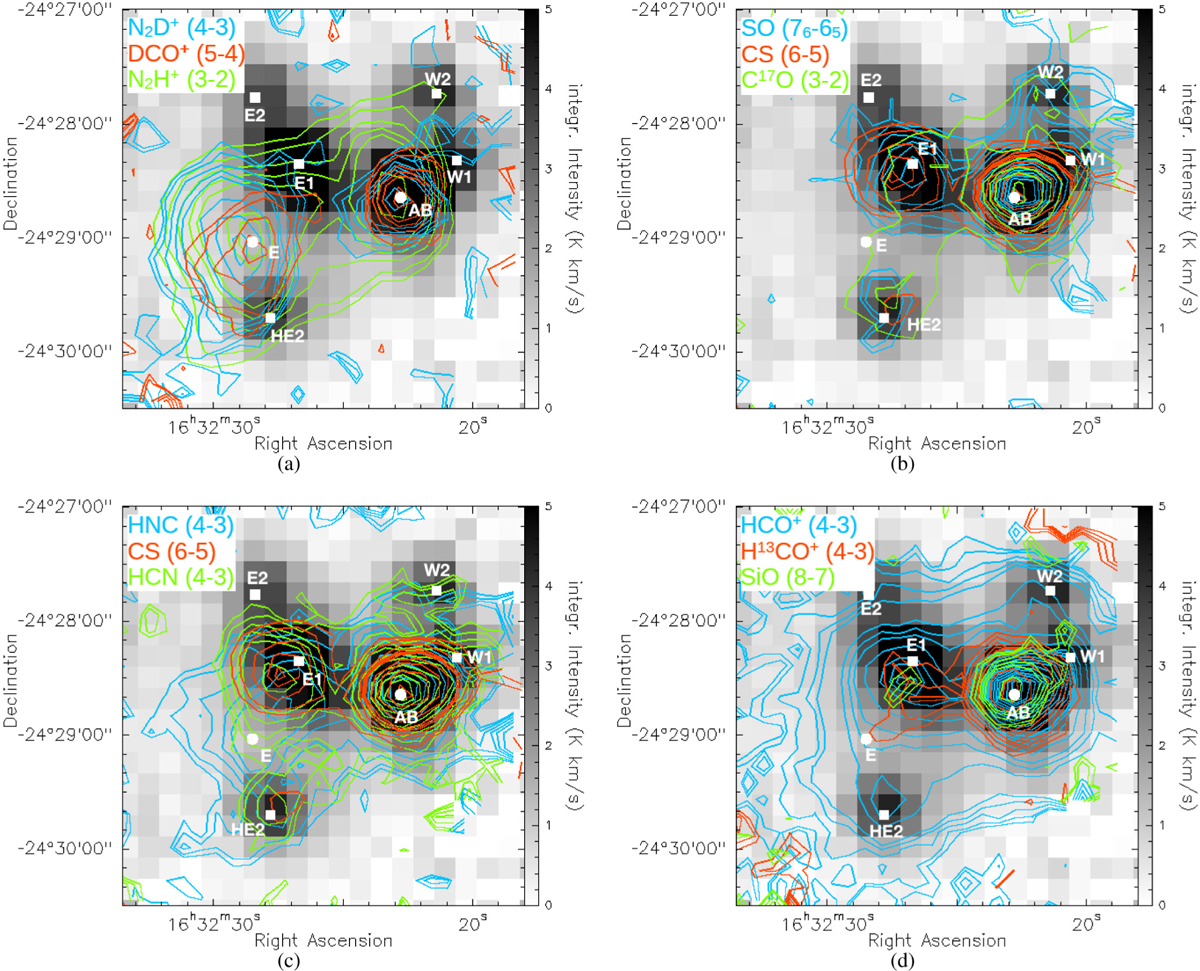
Gray-scale image of H2CO (41,4−31,3) integrated in a velocity range between −4.6 km s−1 and 9.9 km s−1 overlaid with contours of integrated line emission for multiple molecular species, as shown in the upper left corner. Contours are drawn at 3σ, in steps of 2σ between 4σ and 10σ and in steps of 10σ afterwards. Top panels: a) Additional contours are drawn for N2H+ (18σ) and DCO+ (15σ). Major differences between displayed species can be seen around the region of the pre stellar core 16293E. b) Additional contours are drawn for CS (9σ), SO (15σ), and C17O (14σ). Bottom panels: c) Additional contours are drawn for HNC (14σ), HCN (16σ), and CS (9σ). d) Additional contours are drawn for HCO+ (25, 55σ) and H13CO+ (5, 27σ). Notice the differences in peak emission around the E1 region, for which most species peak southern of formaldehyde. White markers show positions discussed in previous sections.
Current usage metrics show cumulative count of Article Views (full-text article views including HTML views, PDF and ePub downloads, according to the available data) and Abstracts Views on Vision4Press platform.
Data correspond to usage on the plateform after 2015. The current usage metrics is available 48-96 hours after online publication and is updated daily on week days.
Initial download of the metrics may take a while.