Fig. B.1
Download original image
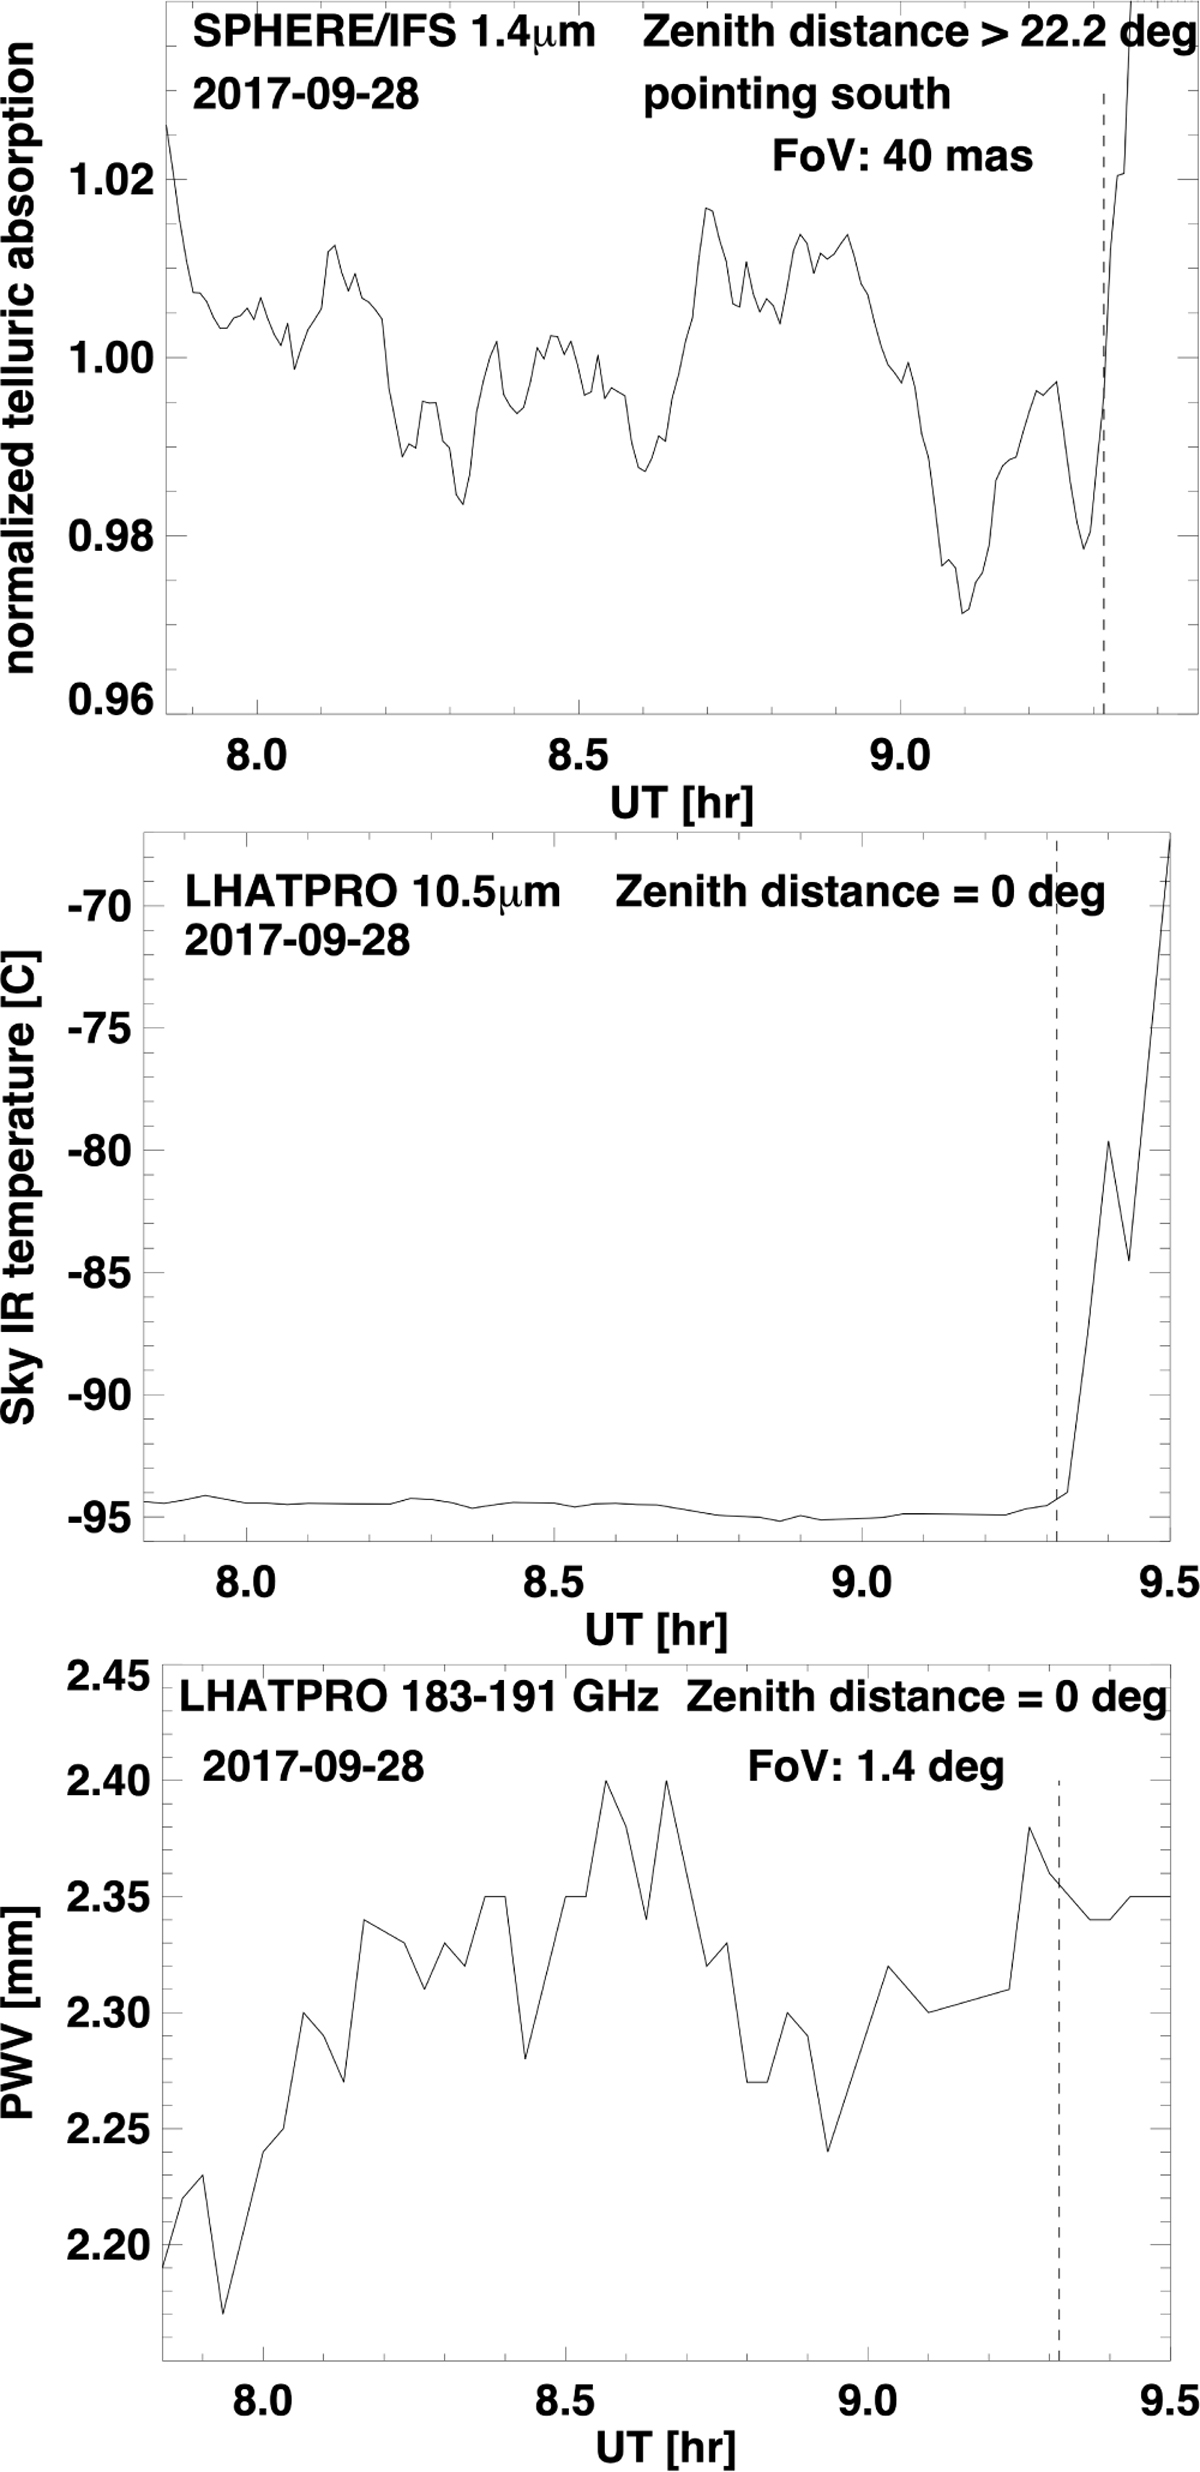
Variations in the atmospheric conditions during the IFS 2017-09-28 observations. Top: Telluric absorption as traced by SPHERE/IFS at ≈ 1.4μm. Middle: Sky infrared temperature as traced by LHATPRO. Bottom: PWV as traced by LHATPRO. The vertical dashed line in all figures marks our cut-off time for the first 140 IFS frames, which form the basis of our spectral analysis, out of a total of 154 IFS data frames.
Current usage metrics show cumulative count of Article Views (full-text article views including HTML views, PDF and ePub downloads, according to the available data) and Abstracts Views on Vision4Press platform.
Data correspond to usage on the plateform after 2015. The current usage metrics is available 48-96 hours after online publication and is updated daily on week days.
Initial download of the metrics may take a while.