Fig. 6
Download original image
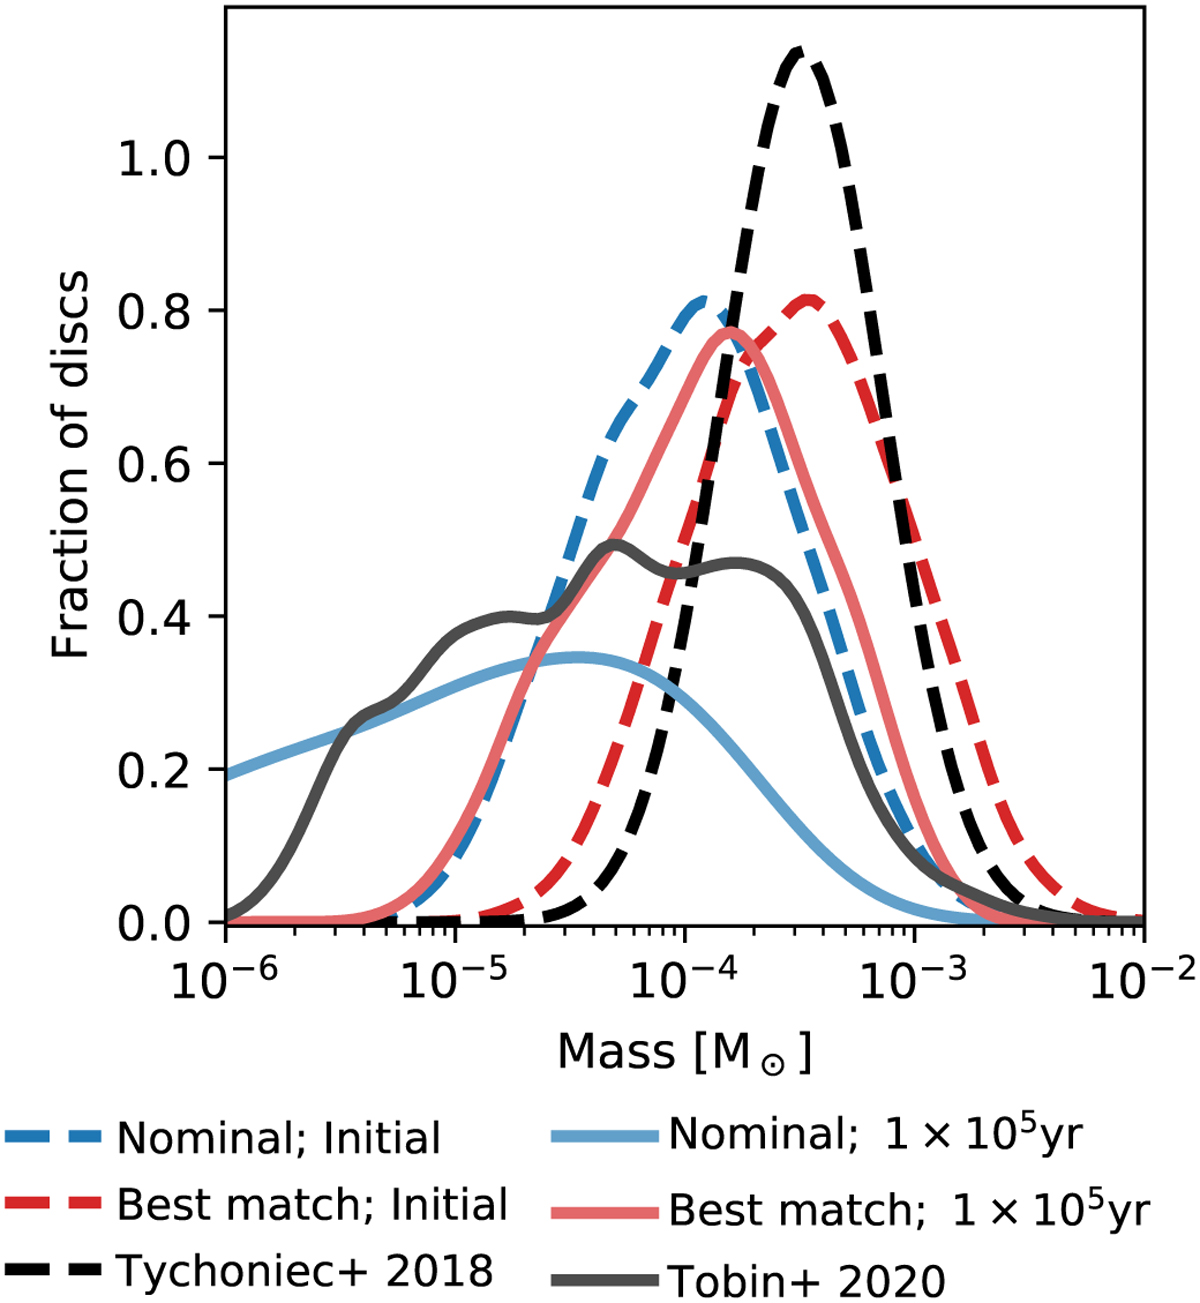
Kernel density estimate for two populations from Figs. 4 and 5, both for their initial conditions (dashed lines) and retrieved disc masses at 100 kyr (solid lines). The initial mass distribution of the best-match population with ![]() (in red) is consistent with the fit by Emsenhuber et al. (2021b) to the data of Tychoniec et al. (2018), which are shown as the dashed black line, while the retrieved masses at 100 kyr are compatible with the non-multiple discs of Tobin et al. (2020).
(in red) is consistent with the fit by Emsenhuber et al. (2021b) to the data of Tychoniec et al. (2018), which are shown as the dashed black line, while the retrieved masses at 100 kyr are compatible with the non-multiple discs of Tobin et al. (2020).
Current usage metrics show cumulative count of Article Views (full-text article views including HTML views, PDF and ePub downloads, according to the available data) and Abstracts Views on Vision4Press platform.
Data correspond to usage on the plateform after 2015. The current usage metrics is available 48-96 hours after online publication and is updated daily on week days.
Initial download of the metrics may take a while.