Fig. 5
Download original image
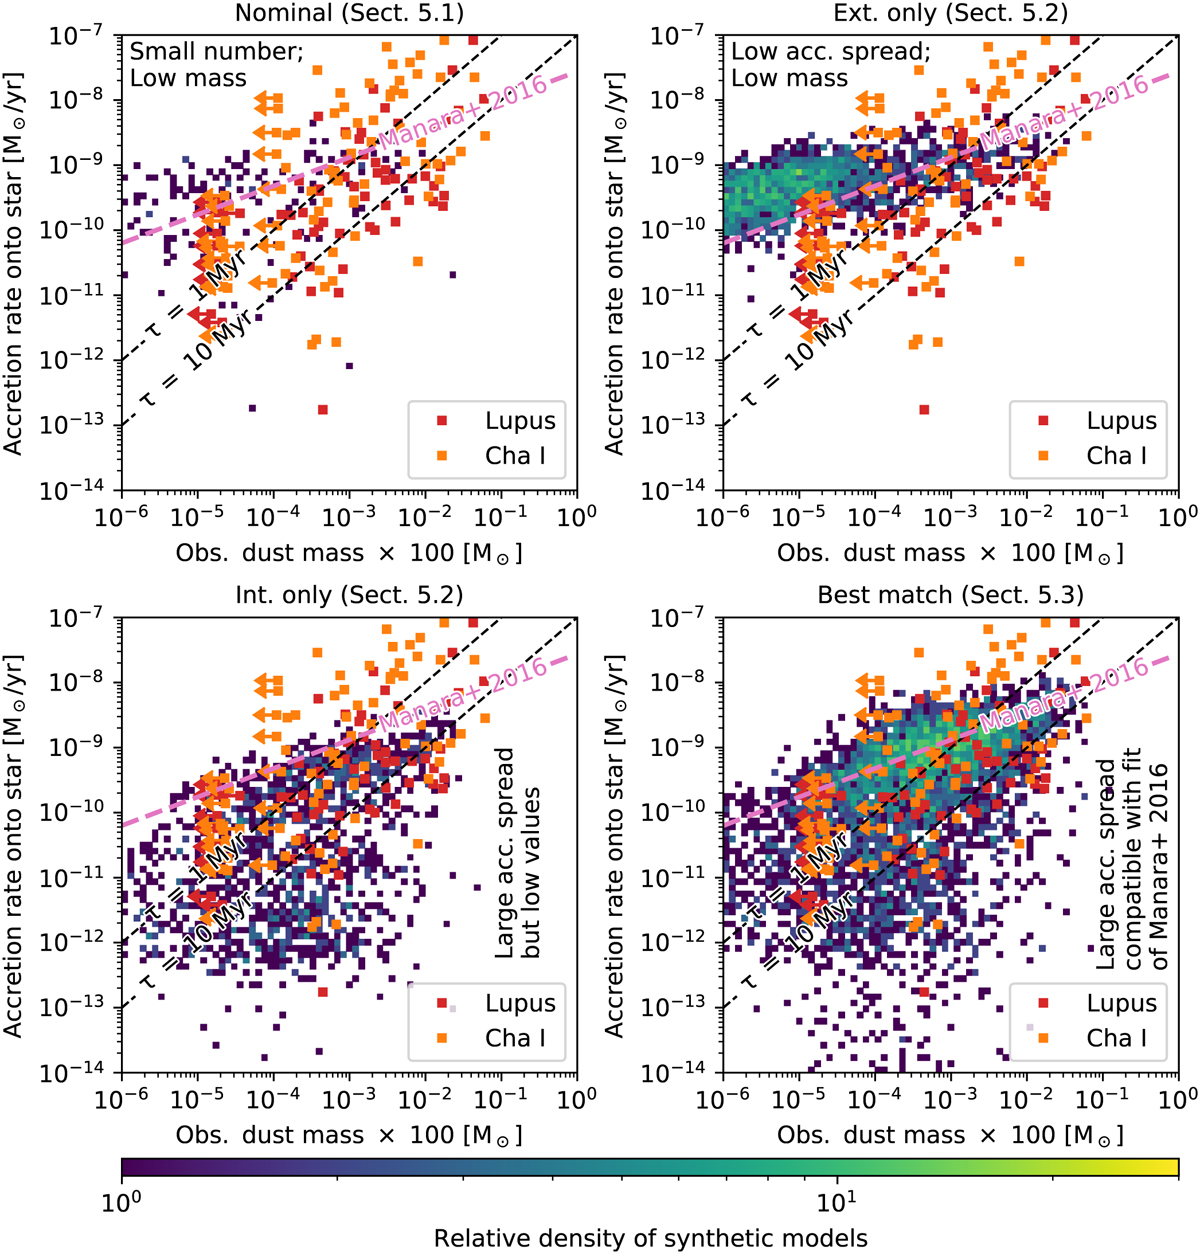
Histogram for stellar accretion rate vs. disc mass at 2Myr and the same synthetic disc populations shown in Fig. 4. The observed data from the Lupus (in red) and Chamaeleon I (orange) star forming regions from Manara et al. (2019) are shown for comparison. Two disc dispersal timescales τ = ṀG/MG of 1 Myr and 10 Myr (assuming that the gas disc mass MG is 100 times the observed dust mass) and the best fit to the data from Manara et al. (2016b) are shown as well.
Current usage metrics show cumulative count of Article Views (full-text article views including HTML views, PDF and ePub downloads, according to the available data) and Abstracts Views on Vision4Press platform.
Data correspond to usage on the plateform after 2015. The current usage metrics is available 48-96 hours after online publication and is updated daily on week days.
Initial download of the metrics may take a while.