Fig. B.1
Download original image
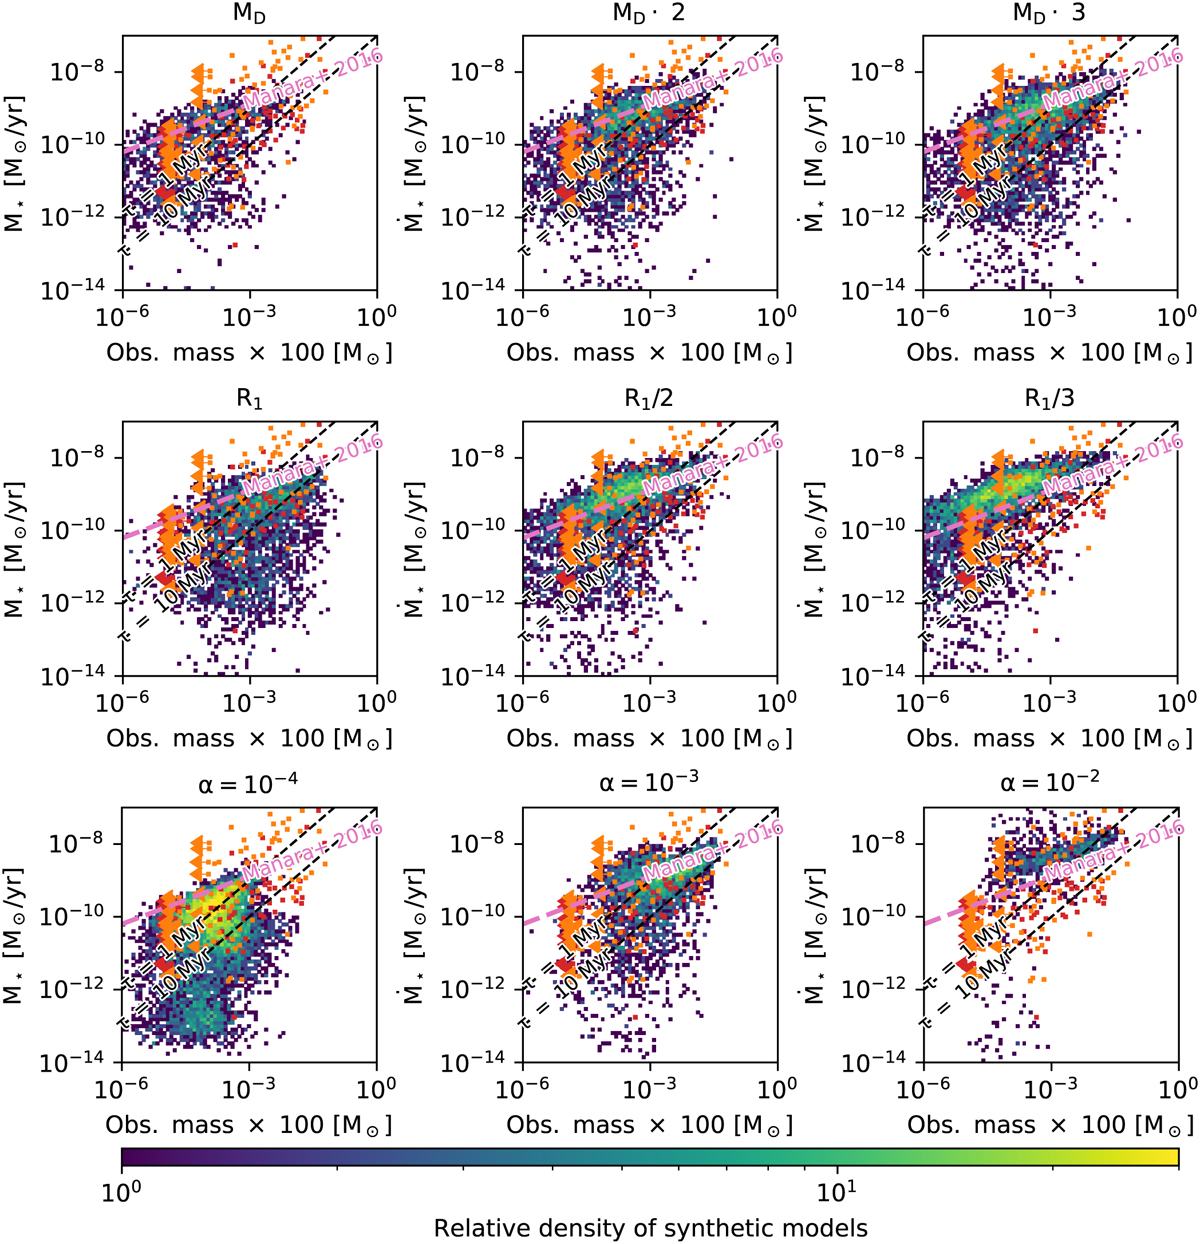
2D histograms for stellar accretion rate versus disc mass at 2 Myr, showing the effects of the different parameters, as given above each panel. The top row shows the effect of increasing the initial disc mass MD. The middle row shows the effect of reducing the disc characteristic radius r1. The bottom row shows the effect of the disc viscosity parameter α. The observed data from the Lupus (in red) and Chamaeleon I (orange) star-forming regions from Manara et al. (2019) are shown for comparison.
Current usage metrics show cumulative count of Article Views (full-text article views including HTML views, PDF and ePub downloads, according to the available data) and Abstracts Views on Vision4Press platform.
Data correspond to usage on the plateform after 2015. The current usage metrics is available 48-96 hours after online publication and is updated daily on week days.
Initial download of the metrics may take a while.