Open Access
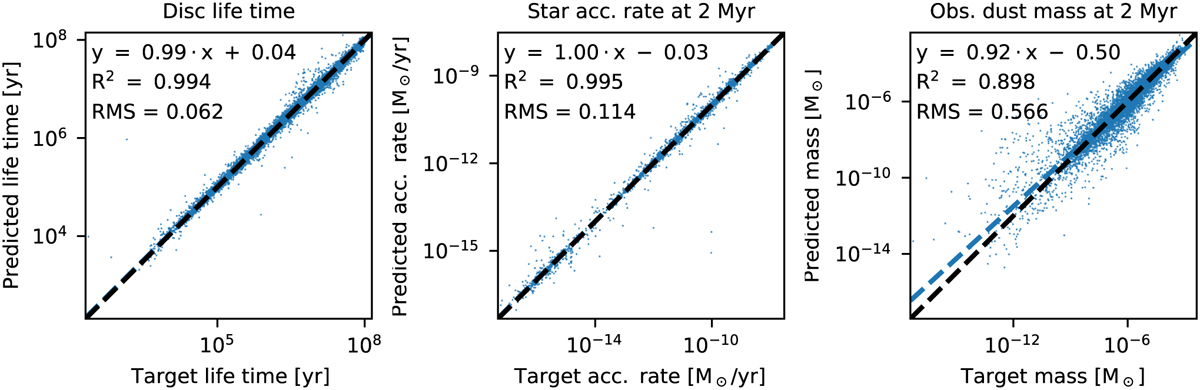
Fig. 1
Download original image
Performance of three surrogate models based on the comparison of the predicted and actual values of the testing set. The insert values show the best regression (ordinary least squares), the Pearson correlation coefficient R2, and the RMS of the differences between each predicted and actual value.
Current usage metrics show cumulative count of Article Views (full-text article views including HTML views, PDF and ePub downloads, according to the available data) and Abstracts Views on Vision4Press platform.
Data correspond to usage on the plateform after 2015. The current usage metrics is available 48-96 hours after online publication and is updated daily on week days.
Initial download of the metrics may take a while.