Open Access
Fig. 12.
Download original image
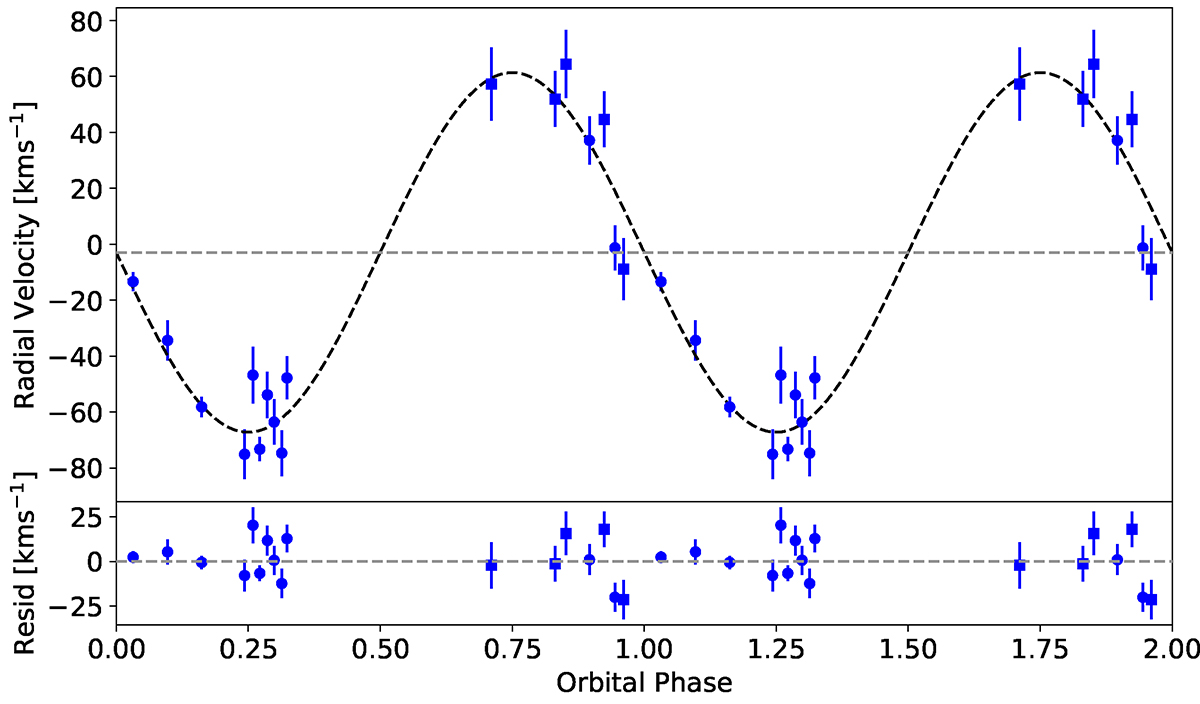
RV curve of KPD 0629-0016 phased to the most probable orbital period with the best-fitting RV model curve shown with the black sinusoidal curve. Data observed with the EMMI spectrograph are shown with the blue circles and the EFOSC2 data are shown with the blue squares. Lower panel shows the residuals.
Current usage metrics show cumulative count of Article Views (full-text article views including HTML views, PDF and ePub downloads, according to the available data) and Abstracts Views on Vision4Press platform.
Data correspond to usage on the plateform after 2015. The current usage metrics is available 48-96 hours after online publication and is updated daily on week days.
Initial download of the metrics may take a while.