Open Access
Fig. 11.
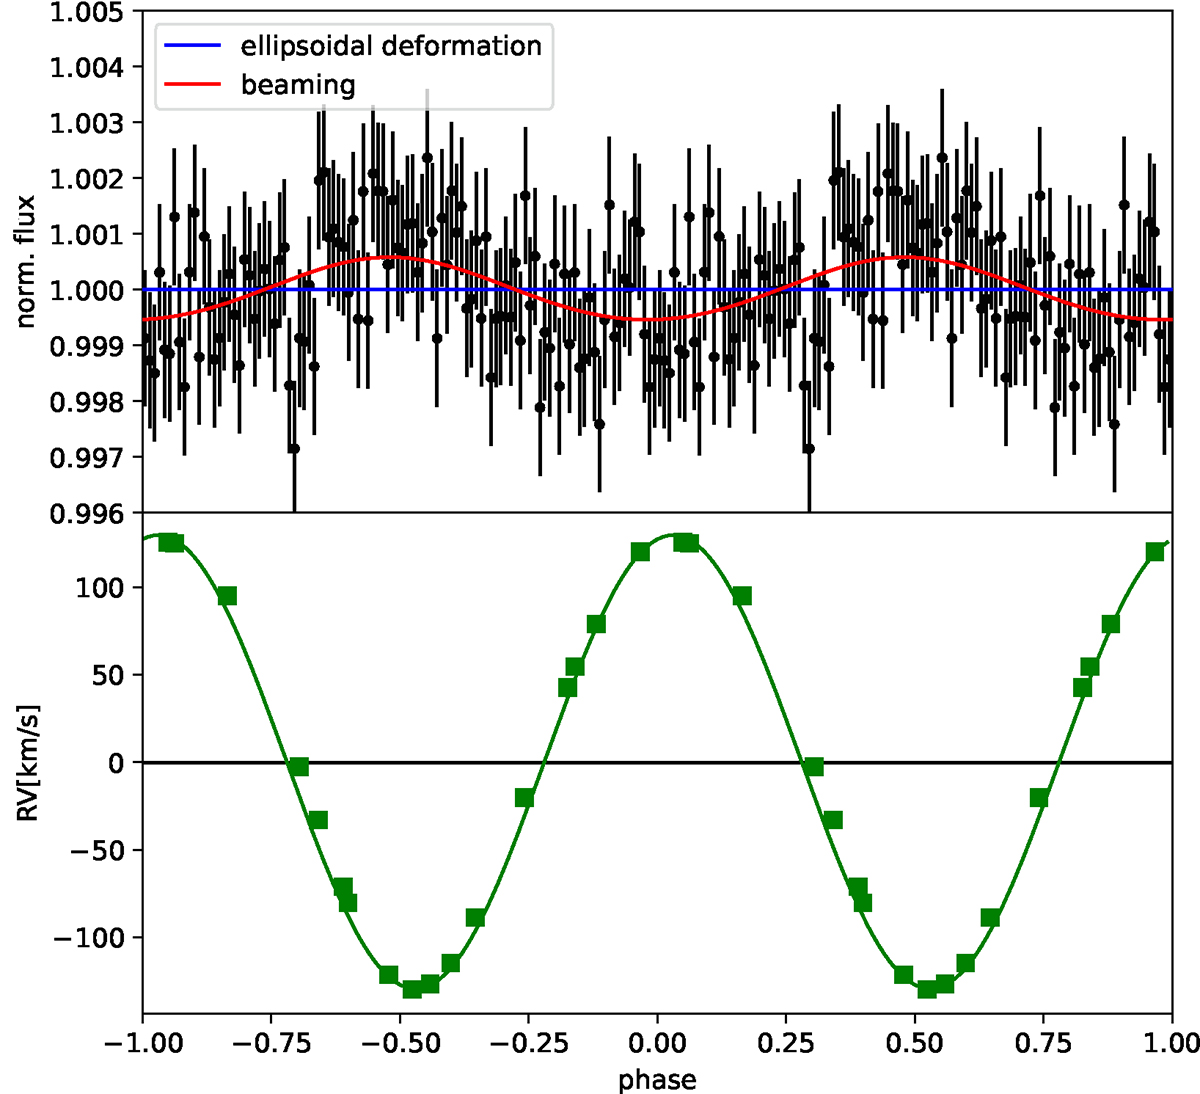
Download original image
Phased TESS light curve and RV curve of PG 1232-136. Upper panel shows the TESS light curve phased with the period determined from the TESS light curve. Lower panel shows the RV curve measured by Edelmann et al. (2005) phased with the same period.
Current usage metrics show cumulative count of Article Views (full-text article views including HTML views, PDF and ePub downloads, according to the available data) and Abstracts Views on Vision4Press platform.
Data correspond to usage on the plateform after 2015. The current usage metrics is available 48-96 hours after online publication and is updated daily on week days.
Initial download of the metrics may take a while.