Fig. 3
Download original image
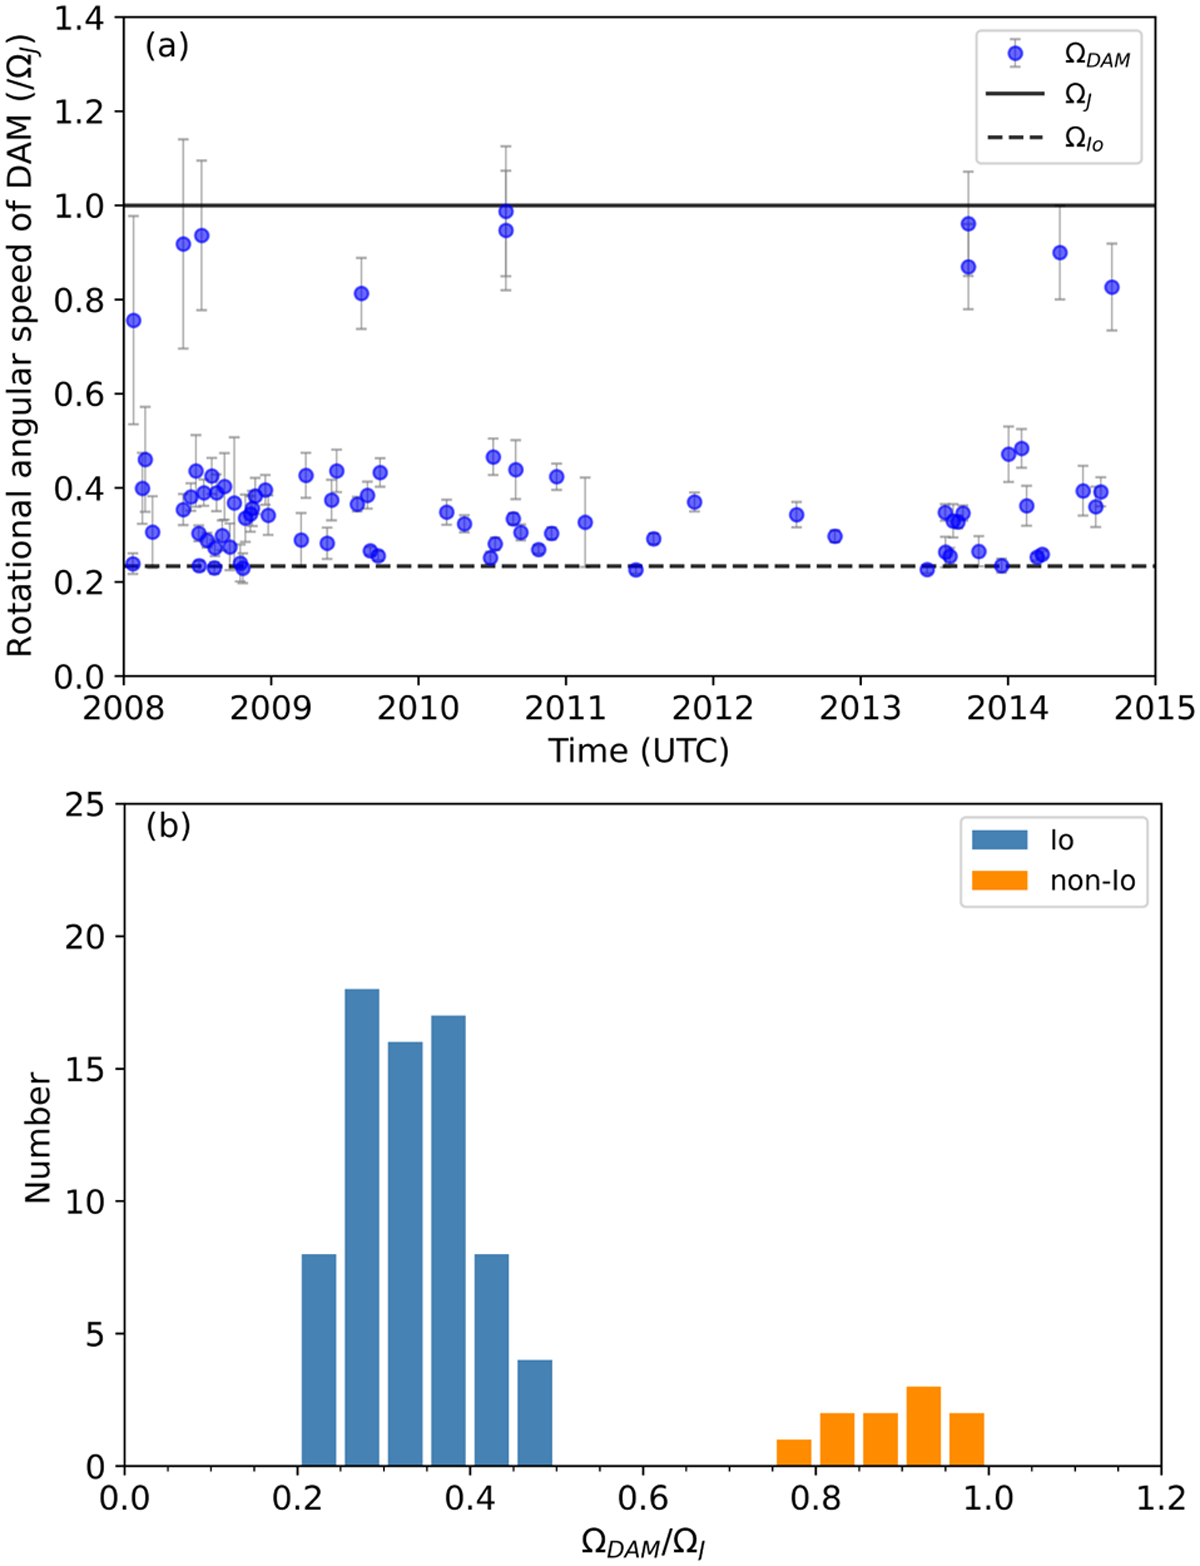
Statistical rotational angular speed of DAM emissions. Panel (a): median values and error bars indicating the time uncertainty when considering ±4 min on the radio dynamic spectrum. The rotational angular speed of Io and Jupiter are represented by a dashed line and a solid line, respectively. Panel (b): histogram of the averaged rotational angular speed of DAM emissions in bins of 0.05 ΩJ. These events can be divided into Io-related (blue bars) and non-Io-related (orange bars) DAM emissions.
Current usage metrics show cumulative count of Article Views (full-text article views including HTML views, PDF and ePub downloads, according to the available data) and Abstracts Views on Vision4Press platform.
Data correspond to usage on the plateform after 2015. The current usage metrics is available 48-96 hours after online publication and is updated daily on week days.
Initial download of the metrics may take a while.