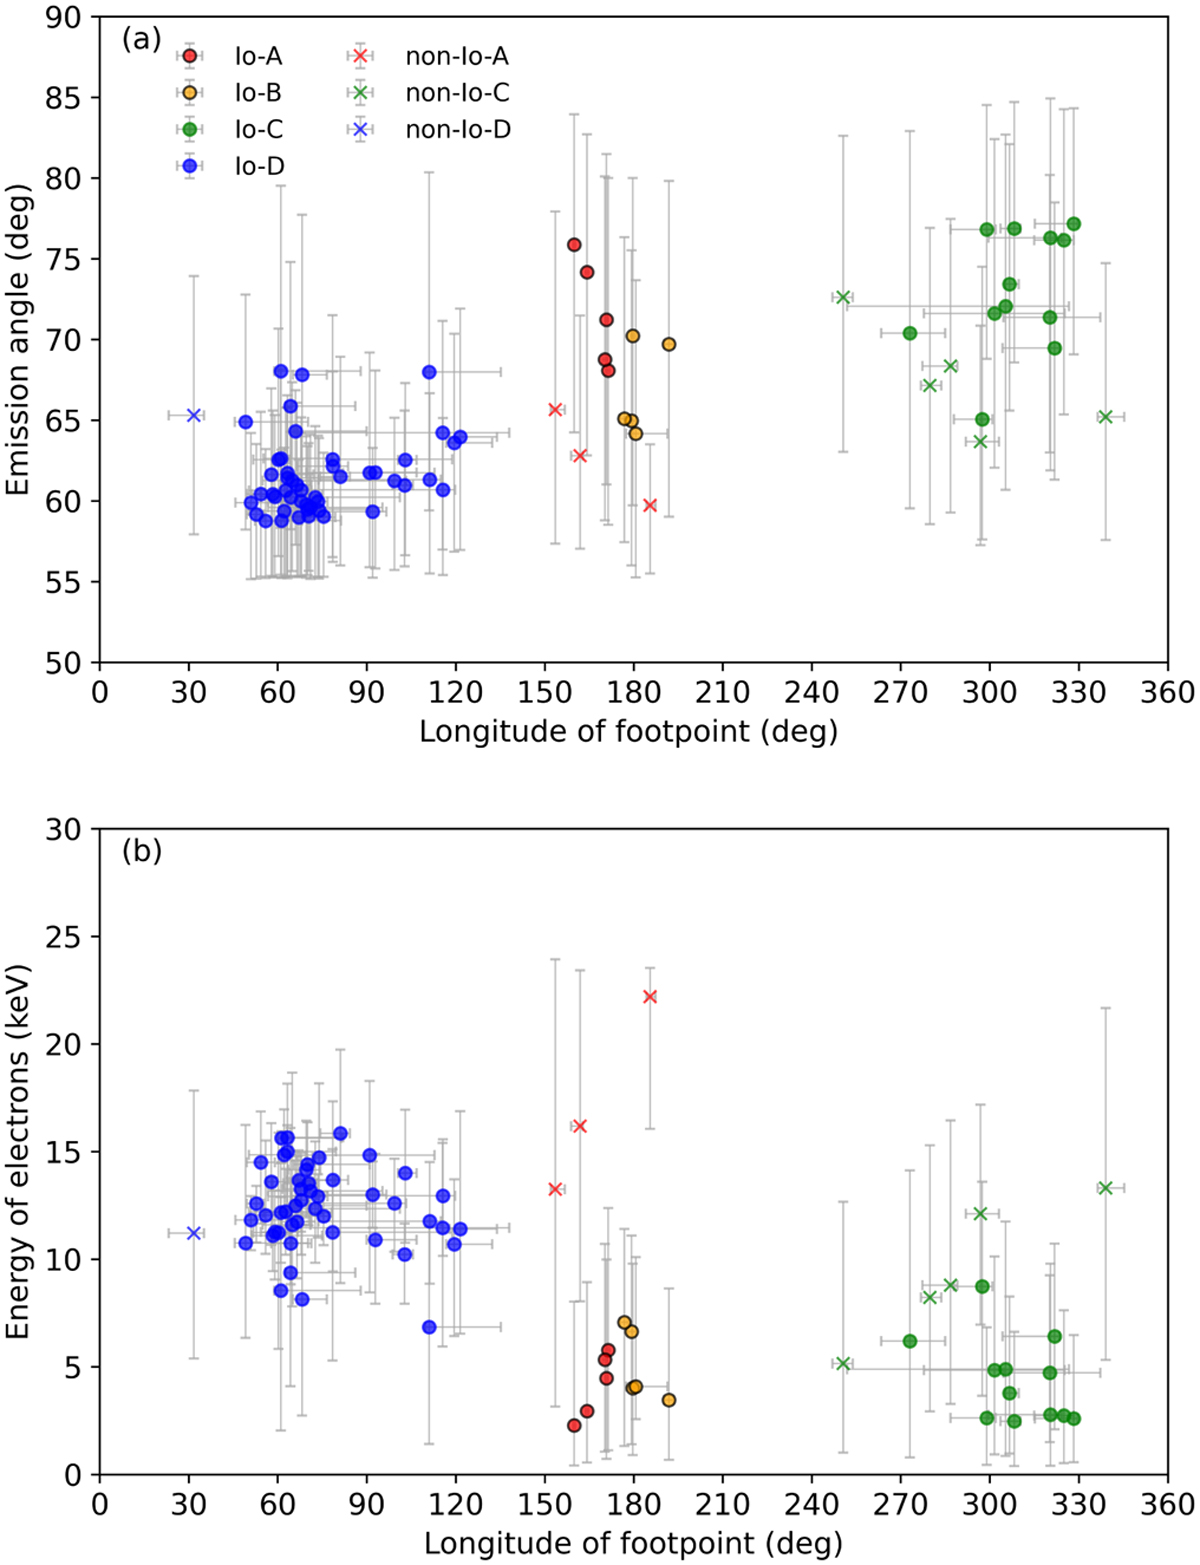
Fig. 16
Download original image
Statistical emission parameters versus longitude of DAM source footprints. Panel (a): comparison for emission angle. Panel (b): comparison for active electron energy. The markers give the median values, and the gray bars give the top and bottom tenth percentiles. The dots with black contours in two panels represent the events observed by NDA.
Current usage metrics show cumulative count of Article Views (full-text article views including HTML views, PDF and ePub downloads, according to the available data) and Abstracts Views on Vision4Press platform.
Data correspond to usage on the plateform after 2015. The current usage metrics is available 48-96 hours after online publication and is updated daily on week days.
Initial download of the metrics may take a while.