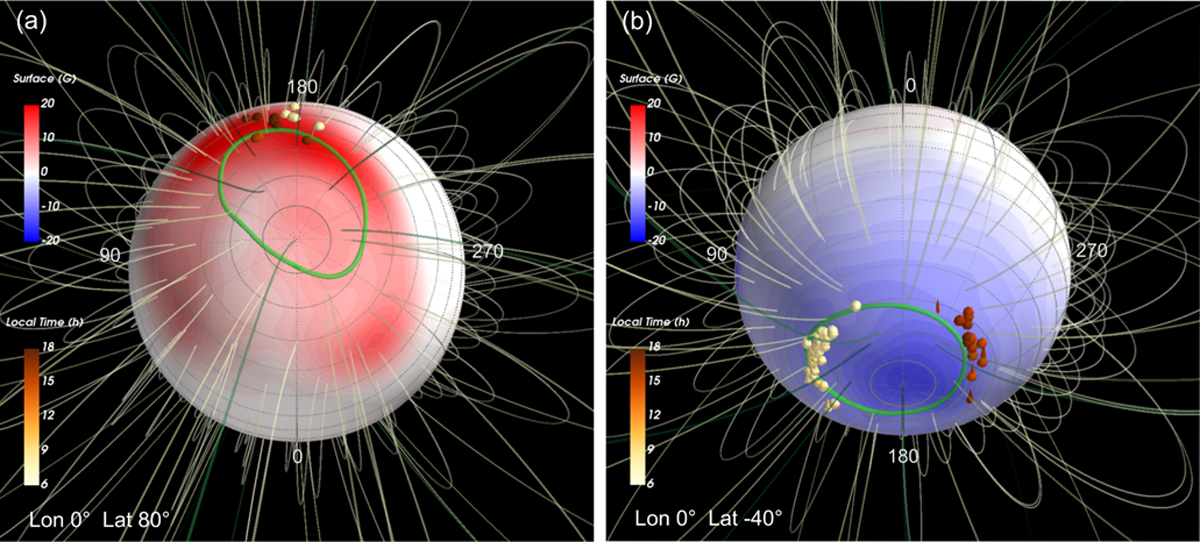
Fig. 15
Download original image
Three-dimensional distribution of source footprints. Panel (a): distribution in the northern hemisphere. Panel (b): distribution in the southern hemisphere. The blue-to-red color on the ellipsoid surface of Jupiter shows the radial component of the magnetic field. Spherical and conical markers indicate the mean source footprints of the Io-DAM and non-Io DAM, respectively, and the color on the markers gives the local time. The green lines show the Io auroral footprints in the northern and southern hemispheres. The longitude and latitude shown in the lower-left corner of each panel indicate the position of Jupiter’s disk center.
Current usage metrics show cumulative count of Article Views (full-text article views including HTML views, PDF and ePub downloads, according to the available data) and Abstracts Views on Vision4Press platform.
Data correspond to usage on the plateform after 2015. The current usage metrics is available 48-96 hours after online publication and is updated daily on week days.
Initial download of the metrics may take a while.